7 Reporting and Results
Scoring of Dynamic Learning Maps® (DLM®) assessments is based on linkage levels mastered across all assessed Essential Elements (EEs). Performance levels describe overall achievement in each subject based on the total linkage levels mastered, with students achieving At Target or Advanced demonstrating proficiency. This chapter summarizes assessment results for the DLM Alternate Assessment System and presents evidence of their appropriateness.
The chapter begins by presenting the number of students who participated in the assessment in 2021–2022, followed by student performance data. Performance data are described in terms of the percentage of students achieving at each performance level both overall and by student group. The chapter then describes how students demonstrated linkage level mastery from among three scoring rules as well as the distribution of the highest linkage level mastered by each student and preliminary evidence about how educators define skill mastery. Because writing testlets are scored by the test administrator, evidence of interrater reliability of writing sample scoring is evaluated. The chapter then summarizes evidence that students who meet the DLM alternate achievement standards are prepared to pursue postsecondary opportunities. Finally, the chapter describes the data files, score reports, guides for interpreting score reports, and quality-control procedures for data files and score reports.
7.1 Student Participation
During 2021–2022, assessments were administered to 13,641 students in 6 states. Counts of students tested in each state are displayed in Table 7.1. The assessments were administered by 4,606 educators in 3,447 schools and 1,168 school districts. Operational assessments were administered during the two instructionally embedded windows. A total of 362,591 test sessions were administered across both assessment windows. One test session is one testlet taken by one student. Only test sessions that were complete at the close of each testing window counted toward the total sessions.
| State | Students (n) |
|---|---|
| Arkansas | 2,518 |
| Delaware | 870 |
| Iowa | 2,863 |
| Kansas | 2,433 |
| Missouri | 4,365 |
| North Dakota | 592 |
Table 7.2 summarizes the number of students assessed in each grade. In grades 3–8, over 1,680 students participated in each grade. In high school, the largest number of students participated in grade 10, and the smallest number participated in grade 12. The differences in high school grade-level participation can be traced to differing state-level policies about the grade(s) in which students are assessed.
| Grade | Students (n) |
|---|---|
| 3 | 1,742 |
| 4 | 1,809 |
| 5 | 1,756 |
| 6 | 1,753 |
| 7 | 1,687 |
| 8 | 1,775 |
| 9 | 788 |
| 10 | 1,140 |
| 11 | 1,005 |
| 12 | 186 |
Table 7.3 summarizes the demographic characteristics of the students who participated in the 2021–2022 administration. The distribution of students across the different subgroups was fairly consistent with prior years’ distributions. The majority of participants were male (66%) and white (71%). About 6% of students were monitored or eligible for English learning services.
| Subgroup | n | % |
|---|---|---|
| Gender | ||
| Male | 9,001 | 66.0 |
| Female | 4,640 | 34.0 |
| Race | ||
| White | 9,706 | 71.2 |
| African American | 2,382 | 17.5 |
| Two or more races | 747 | 5.5 |
| Asian | 396 | 2.9 |
| American Indian | 278 | 2.0 |
| Native Hawaiian or Pacific Islander | 90 | 0.7 |
| Alaska Native | 42 | 0.3 |
| Hispanic ethnicity | ||
| Non-Hispanic | 12,044 | 88.3 |
| Hispanic | 1,597 | 11.7 |
| English learning (EL) participation | ||
| Not EL eligible or monitored | 12,807 | 93.9 |
| EL eligible or monitored | 834 | 6.1 |
7.2 Student Performance
Student performance on DLM assessments is interpreted using cut points, For a description of the standard setting process used to determine the cut points, see Chapter 6 of this manual. which describe student achievement using four performance levels. A student’s performance level is determined based on the total number of linkage levels mastered across the assessed EEs.
For the 2021–2022 administration, student performance was reported using four performance levels:
- The student demonstrates Emerging understanding of and ability to apply content knowledge and skills represented by the EEs.
- The student’s understanding of and ability to apply targeted content knowledge and skills represented by the EEs is Approaching the Target.
- The student’s understanding of and ability to apply content knowledge and skills represented by the EEs is At Target. This performance level is considered to be meeting achievement expectations.
- The student demonstrates Advanced understanding of and ability to apply targeted content knowledge and skills represented by the EEs.
7.2.1 Overall Performance
Table 7.4 reports the percentage of students achieving at each performance level from the 2021–2022 administration for ELA and mathematics. While the high school mathematics blueprints organize EEs by grade level, the high school ELA blueprints are based on grade bands that mirror the organization of the EEs. In ELA, the percentage of students who achieved at the At Target or Advanced levels (i.e., proficient) ranged from approximately 11% to 41%. In mathematics, the percentage of students meeting or exceeding At Target expectations ranged from approximately 8% to 17%.
| Grade | Emerging (%) | Approaching (%) | At Target (%) | Advanced (%) | At Target + Advanced (%) |
|---|---|---|---|---|---|
| English language arts | |||||
| 3 (n = 1,741) | 34.3 | 24.6 | 33.1 | 7.9 | 41.1 |
| 4 (n = 1,806) | 35.6 | 23.8 | 35.1 | 5.5 | 40.6 |
| 5 (n = 1,754) | 30.6 | 31.6 | 31.6 | 6.2 | 37.8 |
| 6 (n = 1,752) | 33.2 | 33.7 | 28.4 | 4.6 | 33.0 |
| 7 (n = 1,686) | 39.7 | 35.6 | 19.6 | 5.1 | 24.7 |
| 8 (n = 1,775) | 52.1 | 24.7 | 17.5 | 5.7 | 23.2 |
| 9–10 (n = 1,926) | 63.2 | 25.9 | 8.6 | 2.3 | 10.9 |
| 11–12 (n = 1,188) | 55.5 | 28.5 | 12.0 | 4.0 | 16.0 |
| Mathematics | |||||
| 3 (n = 1,735) | 57.3 | 32.6 | 6.4 | 3.6 | 10.0 |
| 4 (n = 1,806) | 52.6 | 30.3 | 11.7 | 5.4 | 17.1 |
| 5 (n = 1,753) | 55.4 | 32.0 | 9.0 | 3.6 | 12.5 |
| 6 (n = 1,752) | 62.8 | 29.5 | 5.9 | 1.8 | 7.7 |
| 7 (n = 1,682) | 66.5 | 22.9 | 6.8 | 3.7 | 10.5 |
| 8 (n = 1,771) | 61.8 | 24.0 | 12.0 | 2.3 | 14.2 |
| 9 (n = 780) | 58.2 | 25.1 | 12.4 | 4.2 | 16.7 |
| 10 (n = 1,135) | 39.6 | 45.6 | 12.2 | 2.5 | 14.7 |
| 11 (n = 999) | 55.7 | 35.0 | 7.2 | 2.1 | 9.3 |
7.2.2 Subgroup Performance
Data collection for DLM assessments includes demographic data on gender, race, ethnicity, and English learning status. Table 7.5 and Table 7.6 summarize the disaggregated frequency distributions for ELA and mathematics, respectively, collapsed across all assessed grade levels. Although state education agencies each have their own rules for minimum student counts needed to support public reporting of results, small counts are not suppressed here because results are aggregated across states and individual students cannot be identified.
|
Emerging
|
Approaching
|
At Target
|
Advanced
|
At Target +
Advanced |
||||||
|---|---|---|---|---|---|---|---|---|---|---|
| Subgroup | n | % | n | % | n | % | n | % | n | % |
| Gender | ||||||||||
| Male | 3,881 | 43.1 | 2,523 | 28.0 | 2,122 | 23.6 | 470 | 5.2 | 2,592 | 28.8 |
| Female | 1,948 | 42.1 | 1,358 | 29.3 | 1,092 | 23.6 | 234 | 5.1 | 1,326 | 28.6 |
| Race | ||||||||||
| White | 4,116 | 42.5 | 2,715 | 28.0 | 2,325 | 24.0 | 540 | 5.6 | 2,865 | 29.5 |
| African American | 1,081 | 45.4 | 715 | 30.0 | 497 | 20.9 | 87 | 3.7 | 584 | 24.5 |
| Two or more races | 298 | 39.9 | 220 | 29.5 | 190 | 25.5 | 38 | 5.1 | 228 | 30.6 |
| Asian | 183 | 46.2 | 122 | 30.8 | 78 | 19.7 | 13 | 3.3 | 91 | 23.0 |
| American Indian | 88 | 31.7 | 75 | 27.0 | 93 | 33.5 | 22 | 7.9 | 115 | 41.4 |
| Native Hawaiian or Pacific Islander | 49 | 54.4 | 20 | 22.2 | 19 | 21.1 | 2 | 2.2 | 21 | 23.3 |
| Alaska Native | 14 | 33.3 | 14 | 33.3 | 12 | 28.6 | 2 | 4.8 | 14 | 33.3 |
| Hispanic ethnicity | ||||||||||
| Non-Hispanic | 5,116 | 42.5 | 3,411 | 28.3 | 2,868 | 23.8 | 639 | 5.3 | 3,507 | 29.1 |
| Hispanic | 713 | 44.7 | 470 | 29.5 | 346 | 21.7 | 65 | 4.1 | 411 | 25.8 |
| English learning (EL) participation | ||||||||||
| Not EL eligible or monitored | 5,485 | 42.9 | 3,615 | 28.3 | 3,024 | 23.6 | 670 | 5.2 | 3,694 | 28.9 |
| EL eligible or monitored | 344 | 41.2 | 266 | 31.9 | 190 | 22.8 | 34 | 4.1 | 224 | 26.9 |
|
Emerging
|
Approaching
|
At Target
|
Advanced
|
At Target +
Advanced |
||||||
|---|---|---|---|---|---|---|---|---|---|---|
| Subgroup | n | % | n | % | n | % | n | % | n | % |
| Gender | ||||||||||
| Male | 5,028 | 56.8 | 2,645 | 29.9 | 861 | 9.7 | 311 | 3.5 | 1,172 | 13.3 |
| Female | 2,662 | 58.3 | 1,421 | 31.1 | 357 | 7.8 | 128 | 2.8 | 485 | 10.6 |
| Race | ||||||||||
| White | 5,373 | 56.4 | 2,904 | 30.5 | 915 | 9.6 | 337 | 3.5 | 1,252 | 13.1 |
| African American | 1,442 | 61.6 | 695 | 29.7 | 156 | 6.7 | 49 | 2.1 | 205 | 8.8 |
| Two or more races | 410 | 55.1 | 237 | 31.9 | 74 | 9.9 | 23 | 3.1 | 97 | 13.0 |
| Asian | 257 | 65.4 | 96 | 24.4 | 29 | 7.4 | 11 | 2.8 | 40 | 10.2 |
| American Indian | 129 | 47.1 | 96 | 35.0 | 31 | 11.3 | 18 | 6.6 | 49 | 17.9 |
| Native Hawaiian or Pacific Islander | 60 | 67.4 | 21 | 23.6 | 8 | 9.0 | 0 | 0.0 | 8 | 9.0 |
| Alaska Native | 19 | 45.2 | 17 | 40.5 | 5 | 11.9 | 1 | 2.4 | 6 | 14.3 |
| Hispanic ethnicity | ||||||||||
| Non-Hispanic | 6,762 | 57.1 | 3,588 | 30.3 | 1,093 | 9.2 | 392 | 3.3 | 1,485 | 12.5 |
| Hispanic | 928 | 58.8 | 478 | 30.3 | 125 | 7.9 | 47 | 3.0 | 172 | 10.9 |
| English learning (EL) participation | ||||||||||
| Not EL eligible or monitored | 7,215 | 57.3 | 3,810 | 30.3 | 1,146 | 9.1 | 411 | 3.3 | 1,557 | 12.4 |
| EL eligible or monitored | 475 | 57.2 | 256 | 30.8 | 72 | 8.7 | 28 | 3.4 | 100 | 12.0 |
7.3 Mastery Results
As described above, the student performance levels are determined by applying cut points to the total number of linkage levels mastered in each subject. In this section, we summarize student mastery of assessed EEs and linkage levels, including how students demonstrated mastery from among three scoring rules and the highest linkage level students tended to master.
7.3.1 Mastery Status Assignment
As described in Chapter 5 of this manual, student responses to assessment items are used to estimate the posterior probability that the student mastered each of the assessed linkage levels using diagnostic classification modeling. Students with a posterior probability of mastery greater than or equal to .80 are assigned a linkage level mastery status of 1, or mastered. Students with a posterior probability of mastery less than .80 are assigned a linkage level mastery status of 0, or not mastered. Maximum uncertainty in the mastery status occurs when the probability is .5 and maximum certainty when the probability approaches 0 or 1. After considering the risk of false positives and negatives and preliminary data analyses, and based on input from the DLM Technical Advisory Committee (TAC), the threshold used to determine mastery classifications was set at .80. In addition to the calculated probability of mastery, students could be assigned mastery of linkage levels within an EE in two other ways: correctly answering 80% of all items administered at the linkage level or through the two-down scoring rule. The two-down scoring rule was implemented to guard against students assessed at the highest linkage levels being overly penalized for incorrect responses. When a student did not demonstrate mastery of the assessed linkage level, mastery was assigned at two linkage levels below the level that was assessed. If a student tested at more than one linkage level for the EE and did not demonstrate mastery at any level, the two-down rule was applied according to the lowest linkage level tested.
Take, for example, a student who tested only on the Target linkage level of an EE. If the student demonstrated mastery of the Target linkage level, as defined by the .80 posterior probability of mastery cutoff or the 80% correct rule, then all linkage levels below and including the Target level would be categorized as mastered. If the student did not demonstrate mastery on the tested Target linkage level, then mastery would be assigned at two linkage levels below the tested linkage level (i.e., the Distal Precursor), rather than showing no evidence of mastery at all. When a student tested at more than one linkage level for the EE and did not demonstrate mastery at any level, the two-down rule was applied according to the lowest linkage level tested. The two-down rule is based on linkage level ordering evidence and the underlying learning map structure (see Chapter 2 of this manual), and it is designed to not penalize students who test at higher linkage levels. That is, in the example above, the student is assigned mastery of the Distal Precursor, rather than being assigned no mastery for the EE.
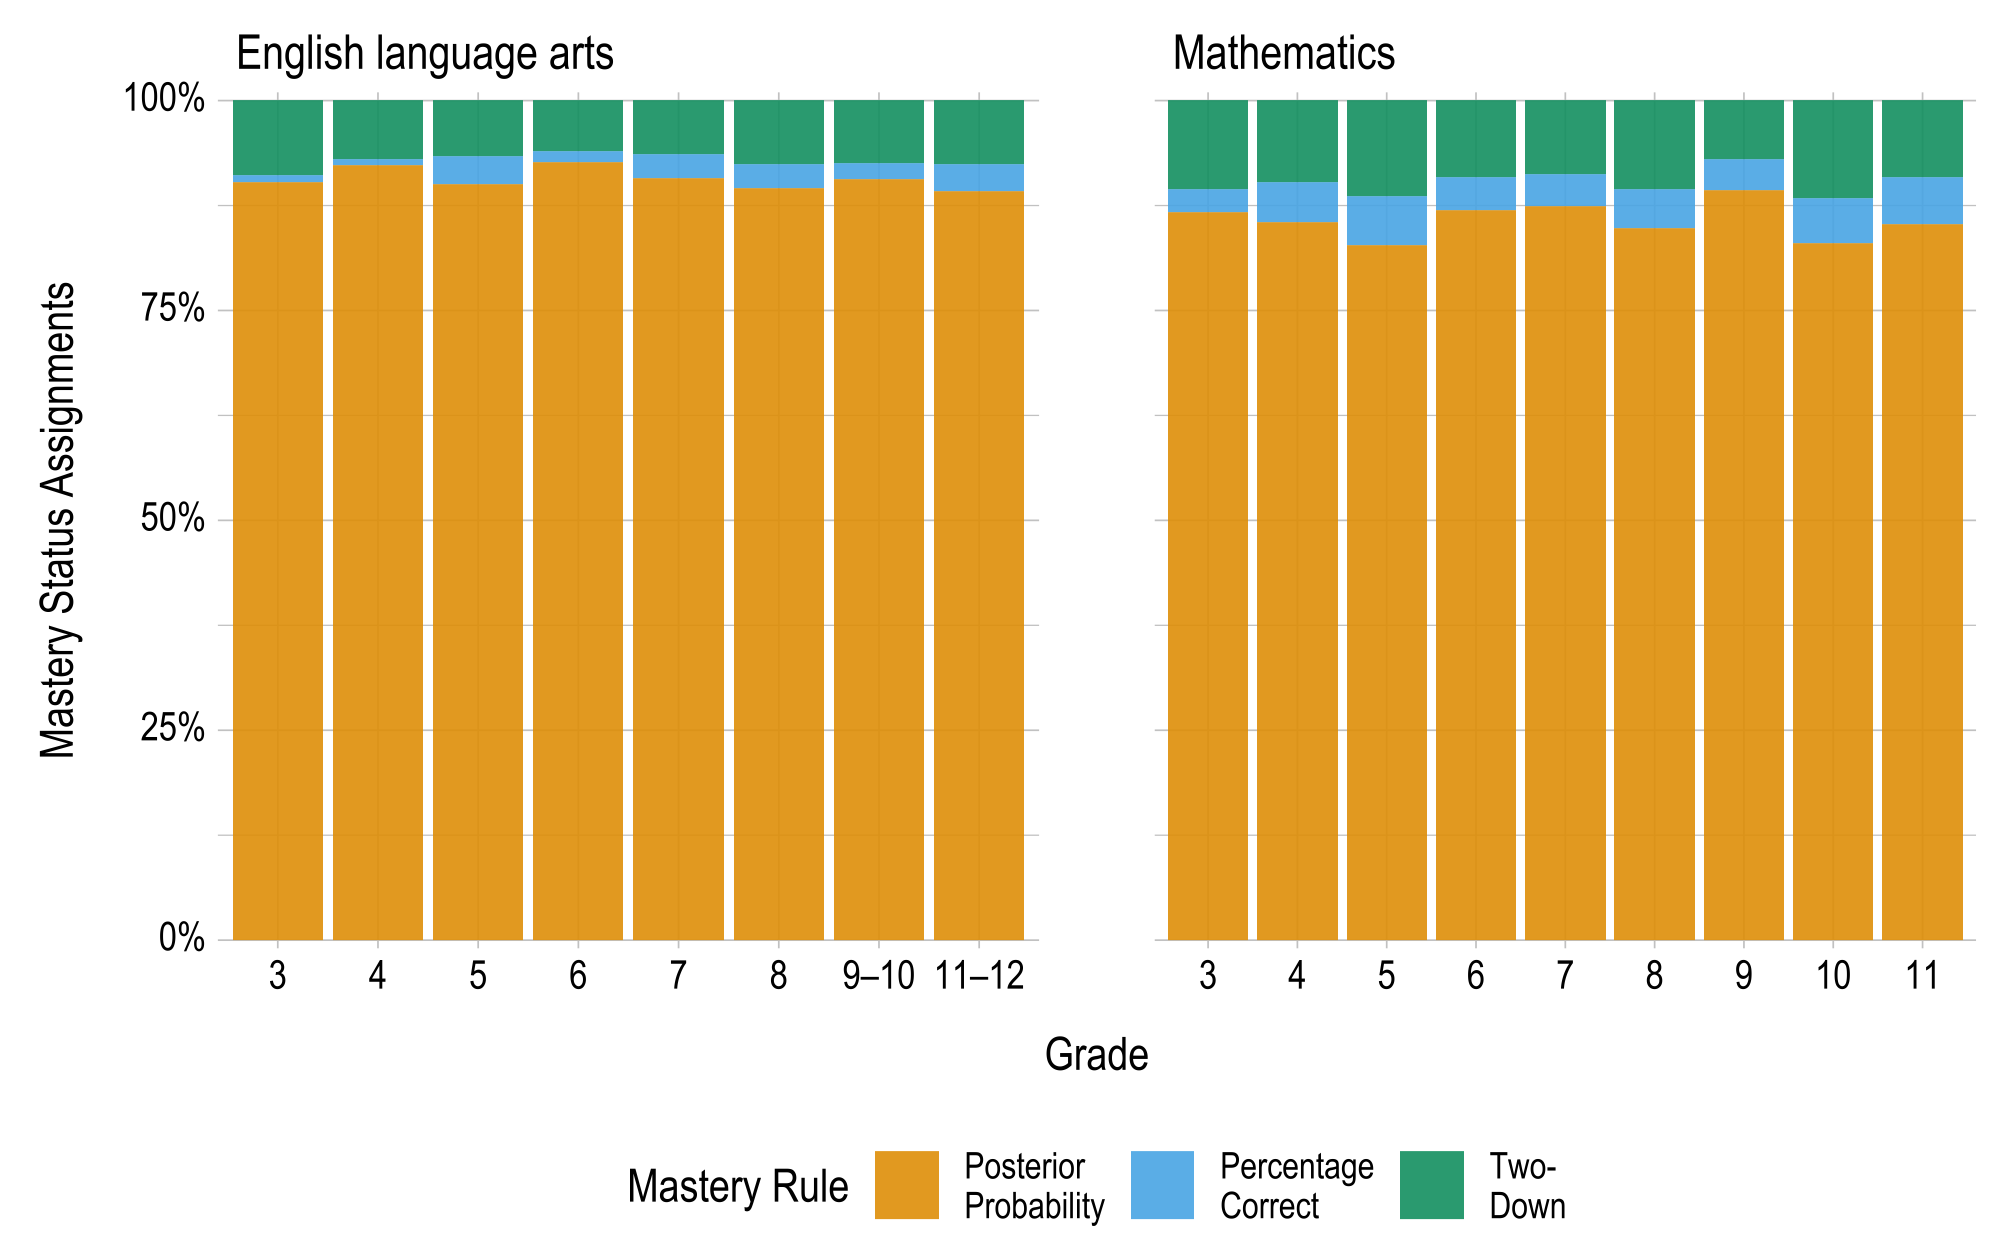
To evaluate the degree to which each mastery assignment rule contributed to students’ linkage level mastery status during the 2021–2022 administration of DLM assessments, the percentage of mastery statuses obtained by each scoring rule was calculated, as shown in Figure 7.1. Posterior probability was given first priority. That is, if multiple scoring rules agreed on the highest linkage level mastered within an EE (e.g., the posterior probability and 80% correct both indicate the Target linkage level as the highest mastered), the mastery status was counted as obtained via the posterior probability. If mastery was not demonstrated by meeting the posterior probability threshold, the 80% scoring rule was imposed, followed by the two-down rule. This means that EEs that were assessed by a student at the lowest two linkage levels (i.e., Initial Precursor and Distal Precursor) are never categorized as having mastery assigned by the two-down rule. This is because the student would either master the assessed linkage level and have the EE counted under the posterior probability or 80% correct scoring rule, or all three scoring rules would agree on the score (i.e., no evidence of mastery), in which case preference is given to the posterior probability. Across grades and subjects, approximately 83%–93% of mastered linkage levels were derived from the posterior probability obtained from the modeling procedure. Approximately 1%–6% of linkage levels were assigned mastery status by the percentage correct rule. The remaining approximately 6%–12% of mastered linkage levels were determined by the minimum mastery, or two-down rule.
Because correct responses to all items measuring the linkage level are often necessary to achieve a posterior probability above the .80 threshold, the percentage correct rule overlapped considerably (but was second in priority) with the posterior probabilities. The percentage correct rule did, however, provide mastery status in those instances where correctly responding to all or most items still resulted in a posterior probability below the mastery threshold. The agreement between these two methods was quantified by examining the rate of agreement between the highest linkage level mastered for each EE for each student. For the 2021–2022 operational year, the rate of agreement between the two methods was 86%. However, in instances in which the two methods disagreed, the posterior probability method indicated a higher level of mastery (and therefore was implemented for scoring) in 77% of cases. Thus, in some instances, the posterior probabilities allowed students to demonstrate mastery when the percentage correct was lower than 80% (e.g., a student completed a four-item testlet and answered three of four items correctly).
Figure 7.1: Linkage Level Mastery Assignment by Mastery Rule for Each Subject and Grade
7.3.2 Linkage Level Mastery
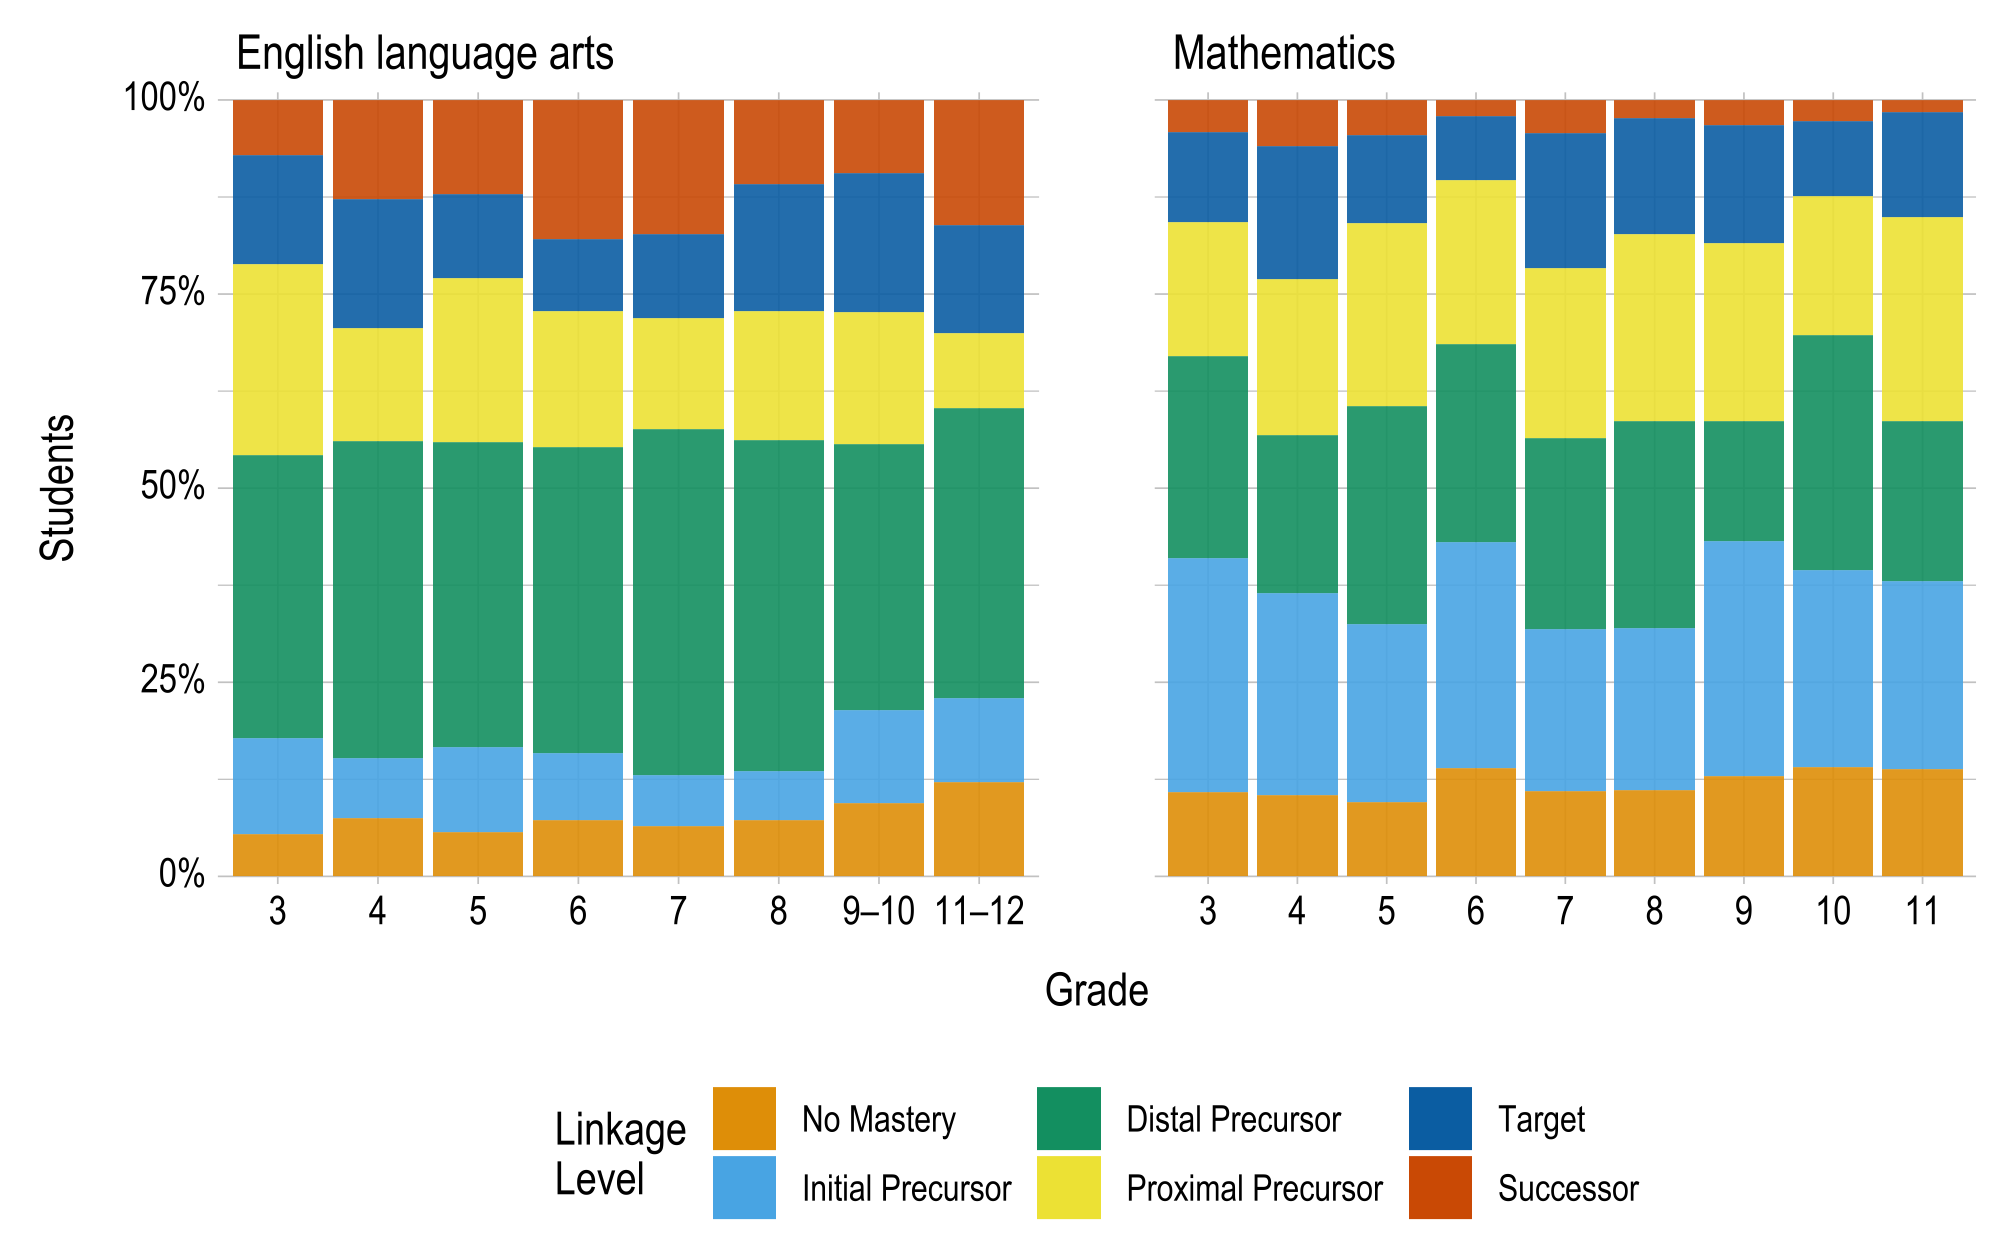
Scoring for DLM assessments determines the highest linkage level mastered for each EE. The linkage levels are (in order): Initial Precursor, Distal Precursor, Proximal Precursor, Target, and Successor. A student can be a master of zero, one, two, three, four, or all five linkage levels, within the order constraints. For example, if a student masters the Proximal Precursor level, they also master all linkage levels lower in the order (i.e., Initial Precursor and Distal Precursor). This section summarizes the distribution of students by highest linkage level mastered across all EEs. For each student, the highest linkage level mastered across all tested EEs was calculated. Then, for each grade and subject, the number of students with each linkage level as their highest mastered linkage level across all EEs was summed and then divided by the total number of students who tested in the grade and subject. This resulted in the proportion of students for whom each linkage level was the highest level mastered.
Figure 7.2 displays the percentage of students who mastered each linkage level as the highest linkage level across all assessed EEs for ELA and mathematics. For example, across all grade 3 ELA EEs, the Distal Precursor level was the highest level that students mastered 36% of the time. The percentage of students who mastered the Target or Successor linkage level ranged from approximately 21% to 30% in ELA and ranged from approximately 10% to 23% in mathematics.
Figure 7.2: Students’ Highest Linkage Level Mastered Across English Language Arts and Mathematics Essential Elements by Grade
7.4 Additional Scoring Evidence
This section describes additional scoring evidence for DLM assessments, including preliminary evidence from a pilot survey collecting information on how educators define skill mastery, interrater reliability of test administrator scoring of student writing samples, and evidence that students who achieve At Target on DLM assessments are on track to pursue postsecondary opportunities.
7.4.1 Pilot Survey Defining Student Mastery
In 2019, DLM staff piloted a survey to obtain information about how educators view skill mastery for students with significant cognitive disabilities who take DLM assessments. The survey was completed by 95 educators across six states and included an open-ended item asking educators to describe how they define student mastery. The survey responses revealed that many educators defined mastery as 75%–80% successful trials on the skills, which is common in special education, but other educators shared ideas around consistent skill demonstration over a longer period of time, generalization and transfer, independence and speed of demonstration, and students’ ability to explain the concept (Nehler & Clark, 2019). While these definitions differ from how mastery is determined on DLM assessments, they provide some insight as to how educators may interpret mastery on DLM assessments.
7.4.2 Writing Sample Scoring
Testlets measuring ELA writing EEs require the student to work outside of Student Portal and interact with the test administrator. The test administrator directs the student to engage in writing tasks and then evaluates the student writing tasks in the online system. Scores do not result from a high-inference process common in large-scale assessment, such as applying analytic or holistic rubrics. Instead, writing samples are evaluated for text features that are easily perceptible to a fluent reader and require little or no inference on the part of the rater (e.g., correct syntax, orthography). The test administrator is presented with an onscreen selected-response item and is instructed to choose the option(s) that best matches the student’s writing sample. Only test administrators rate writing samples, and their item responses are used to determine students’ mastery of linkage levels for writing and some language EEs on the ELA blueprint. Because scores for the writing samples are determined by the test administrator, we annually collect a subset of writing samples and evaluate agreement of writing sample scoring to provide evidence for the quality of writing EE mastery decisions. In the subsequent sections, we describe the process for collecting and scoring samples and report interrater agreement among test administrators. For a complete description of writing testlet design, including example items, see Chapter 3 of this manual.
7.4.2.1 Preparing the Data
Educators administer writing testlets at two levels: emergent and conventional. Emergent testlets measure nodes at the Initial Precursor and Distal Precursor levels, while conventional testlets measure nodes at the Proximal Precursor, Target, and Successor levels. The number of items that evaluate the writing sample per grade-level testlet is summarized in Table 7.7.
Testlets include one to six items evaluating the sample, administered as either multiple-choice or multiple-select multiple-choice items. Because each answer option could correspond to a unique linkage level and/or EE, writing items are dichotomously scored at the option level. Each item, which includes four to nine answer options, was scored as a separate writing item. For this reason, writing items are referred to as writing tasks in the following sections, and the options were scored as individual items. The dichotomous option responses (i.e., each scored as an item) were the basis for the evaluation of interrater agreement.
| Grade | Emergent testlet | Conventional testlet |
|---|---|---|
| 3 | * | 3 |
| 4 | 1 | 4 |
| 5 | * | 2 |
| 6 | * | 4 |
| 7 | 1 | 4 |
| 8 | * | 4 |
| 9 | 1 | 8 |
| 10 | 1 | 8 |
| 11 | 1 | 8 |
| Note. Items varied slightly by blueprint model; the maximum number of items per testlet is reported here. | ||
| * The testlet at this grade included only items evaluating the writing process, with no evaluation of the sample. |
The scoring process for DLM writing testlets is as follows. Data are extracted from the database that houses all DLM data. For writing items, the response-option identifiers are treated as item identifiers so that each response option can be scored as correct or incorrect for the EE and linkage level it measures. Also, response-option dependencies are built in, based on scoring direction provided by the ELA test development team, to score as correct response options that are subsumed under other correct response options. Once the data structure has been transformed and response-option dependencies are accounted for, the writing data are combined with all other data to be included in the scoring process. For more information on the scoring process for linkage level mastery, see Section 7.3.2.
7.4.2.2 Recruitment
Recruitment for the evaluation of interrater agreement of writing samples included the submission of student writing samples and direct recruitment of educators to serve as raters.
7.4.2.2.1 Samples
Educators are annually asked to submit student writing samples. Requested submissions included papers that students used during testlet administration, copies of student writing samples, or photographs of student writing samples. To allow the sample to be matched with test administrator response data, each sample was submitted in the online system to enable direct matching to the administered testlet, including original test administrator responses.
In 2022, DLM staff evaluated interrater reliability for writing samples collected during the 2019–2020 and 2020–2021 administrations. A total of 1,914 student writing samples were submitted from districts in 12 states across the spring windows in 2020 and 2021. In several grades, the emergent writing testlet does not include any tasks that evaluate the writing sample (as shown in Table 7.7); therefore, emergent samples submitted for these grades were not included in the interrater reliability analysis (e.g., Grade 3 emergent writing samples). To lessen the burden on the raters, we sampled approximately 20 writing samples from each grade and writing level (excluding the emergent levels in certain grades described above). This resulted in the assignment of 309 writing samples to raters for evaluation of interrater agreement.
7.4.2.2.2 Raters
Recruited educators were required to have experience administering and rating DLM writing testlets to ensure they had already completed required training and were familiar with how to score the writing samples. Participants were screened and selected using the Accessible Teaching, Learning, and Assessment Systems (ATLAS) recruitment database platform in MemberClicks. Volunteers complete a demographic survey to be considered for ATLAS events, and this information is stored in the database for recruitment purposes. In total, 18 were selected to participate.
Raters had a range of teaching experience, as indicated in Table 7.8. Most had taught ELA and/or students with the most significant cognitive disabilities for at least 6 years. Furthermore, eight raters (44%) reported experience as DLM external reviewers (see Chapter 3 for a description of external review).
|
1–5 years
|
6–10 years
|
> 10 years
|
||||
|---|---|---|---|---|---|---|
| Teaching experience | n | % | n | % | n | % |
| English language arts | 2 | 11.1 | 2 | 11.1 | 14 | 77.8 |
| Students with significant cognitive disabilities | 1 | 5.6 | 4 | 22.2 | 13 | 72.2 |
Demographic information for participants in this study is summarized in Table 7.9. Participating raters were mostly female (78%), white (78%), and non-Hispanic/Latino (89%). Raters came from a variety of teaching settings.
| Subgroup | n | % |
|---|---|---|
| Gender | ||
| Female | 14 | 77.8 |
| Male | 4 | 22.2 |
| Race | ||
| White | 14 | 77.8 |
| Black or African American | 2 | 11.1 |
| American Indian | 1 | 5.6 |
| Asian | 1 | 5.6 |
| Hispanic ethnicity | ||
| Non-Hispanic/Latino | 16 | 88.9 |
| Hispanic/Latino | 2 | 11.1 |
| Teaching setting | ||
| Rural | 7 | 38.9 |
| Urban | 6 | 33.3 |
| Suburban | 5 | 27.8 |
7.4.2.3 Sample Ratings
All ratings occurred during a virtual event in July 2022. Raters were provided with deidentified PDF versions of student writing samples via an online Moodle course, which they could no longer access following the completion of ratings. They were also provided a link to a Qualtrics survey that included the writing tasks corresponding to the grade and level (i.e., emerging or conventional) of the assigned writing sample. Raters submitted all ratings online.
Writing samples were assigned to raters in batches of 13–24, using a partially crossed matrix design to assign each sample to a total of three raters. Thus, educators rated between 60 and 83 writing samples. Table 7.10 summarizes the number of samples that were rated at each grade and level.
|
Number of writing samples
|
|||
|---|---|---|---|
| Grade | Emergent | Conventional | Total number of samples |
| 3 | * | 28 | 28 |
| 4 | 31 | 33 | 64 |
| 5 | * | 19 | 19 |
| 6 | * | 24 | 24 |
| 7 | 24 | 22 | 46 |
| 8 | * | 25 | 25 |
| 9 | 14 | 13 | 27 |
| 10 | 13 | 15 | 28 |
| 11 | 23 | 25 | 48 |
| Total | 105 | 204 | 309 |
| * The testlet at this grade included only items evaluating the writing process, with no evaluation of the sample. | |||
Ratings submitted in Qualtrics were combined with the original spring 2020 and spring 2021 student data from when the writing sample was rated by the student’s educator, resulting in four ratings for each of the 309 student writing samples.
7.4.2.4 Interrater Reliability
Because each writing sample was evaluated by multiple and different raters, interrater reliability was summarized by Fleiss’s kappa and intraclass correlation (ICC) values. The purpose of Fleiss’s kappa is to provide a measure of absolute agreement across two or more raters. Fleiss’s kappa (Fleiss, 1981) is defined as
\[\begin{equation} \kappa=\frac{\bar{P} - \bar{P_e}}{1 - \bar{P_e}} \tag{7.1} \end{equation}\]
where the denominator gives the degree of absolute agreement attainable above chance, and the numerator gives the degree of absolute agreement actually achieved above chance.
The purpose of the ICC is to provide a means for measuring rater agreement and consistency. For interrater reliability studies, rater agreement is of most interest. For this study, a one-way, random-effects model using the average kappa rating was selected because each writing sample was rated by a rater who was randomly selected from the pool of available raters. Using this model, only absolute agreement is measured by the ICC.
To summarize global agreement across all student writing samples, educators’ original ratings (from spring 2022 operational administration) were compared against the additional three ratings obtained during the July 2022 event. Interrater agreement results are presented in Table 7.11. Results are also provided separately for emergent and conventional testlets.
Based on the guidelines specified by Cicchetti (1994), ICC agreement fell in the excellent range (\(\geq\) .75), and Fleiss’s kappa fell in the good (.60 – .74) to excellent range. Agreement was slightly higher for conventional testlets.
| Group | n | ICC | ICC lower bound | ICC upper bound | Fleiss’s \(\kappa\) |
|---|---|---|---|---|---|
| Overall | 309 | .967 | .966 | .969 | .881 |
| EW | 105 | .901 | .887 | .914 | .695 |
| CW | 204 | .969 | .967 | .970 | .886 |
| Note. ICC = intraclass correlation; EW = emergent writing; CW = conventional writing. |
Educator-administered testlets measuring reading and mathematics were not included in the study. Also, although student writing samples were evaluated, the student writing process was not. Additional data collection related to educator fidelity, including fidelity in educator-administered testlets in each subject, is provided in the Test Administration Observations section of Chapter 4 of this manual.
7.4.3 Alignment of At Target Achievement With Postsecondary Opportunities
DLM academic achievement standards are intended to reflect rigorous expectations for students with the most significant cognitive disabilities. During 2019–2020, evidence was collected to evaluate the extent to which the DLM alternate academic achievement standards are aligned to ensure that a student who meets these standards is on track to pursue postsecondary education or competitive integrated employment.
Chapter 2 of this manual provides evidence of vertical alignment for the alternate academic achievement standards to reflect how academic content builds across grades to reflect high expectations for the student population. Here we describe the relationship of DLM alternate academic achievement standards (specifically the At Target performance level) to the knowledge, skills, and understandings needed to pursue postsecondary opportunities.
We developed two hypotheses about the expected relationship between meeting DLM alternate academic achievement standards and being prepared for a variety of postsecondary opportunities.
- Nearly all academic skills will be associated with At Target performance level descriptors at a variety of grades between Grade 3 and high school. Few, if any, academic skills will first occur before Grade 3 At Target or after high school At Target.
- Because academic skills may be associated with multiple opportunities and with soft skills needed for employment and education, we expected Hypothesis 1 to hold for academic skills associated with employment opportunities, education opportunities, and soft skills.
Similar to academic education for all students, academic skills for students with significant cognitive disabilities develops across grades. Individuals use academic skills at varying levels of complexity, depending on specific employment or postsecondary education settings. Therefore, academic skills associated with achieving At Target in lower grades demonstrate where students are able to apply the least complex version of the skill. Given the vertical alignment of DLM content and achievement standards, students are expected to continue learning new skills in subsequent grades and be prepared for more complex applications of the academic skills by the time they transition into postsecondary education and employment.
A panel of experts on secondary transition and/or education of students with significant cognitive disabilities identified postsecondary competitive integrated employment and education opportunities. Their goal was to identify an extensive sampling of opportunities rather than an exhaustive list. Panelists also considered the types of educational and employment opportunities currently available to students with significant cognitive disabilities as well as opportunities that may be more aspirational (i.e., opportunities that may become available in the future). Panelists identified 57 employment opportunities and 7 postsecondary education opportunities. Employment opportunities spanned sectors including agriculture, arts, business, education, health sciences, hospitality, information technology, manufacturing, and transportation.
Panelists next identified the knowledge, skills, and understandings needed to fulfill the responsibilities for the employment opportunities as well as eight common responsibilities across all postsecondary education opportunities. Finally, the panel identified the knowledge, skills, and understandings within soft skills (e.g., social skills, self-advocacy) applicable across multiple postsecondary settings. Subject-matter experts in ELA and mathematics reviewed and refined the academic skill statements to provide clarity and consistency across skills. This resulted in 50 ELA academic skills and 41 mathematics academic skills to be used in the next phase of the study.
The second set of panels, one for each subject, examined the relationship between the academic skills and the types of academic knowledge, skills, and understandings typically associated with meeting the DLM alternate academic achievement standards (i.e., achieving At Target). By identifying the lowest grade where a student achieving At Target is likely to consistently demonstrate the academic skill, the second panel identified the first point where students would be ready to pursue postsecondary opportunities that required the least complex application of the skill.
Panels consisted of general educators and special educators who administered DLM assessments from across DLM states. Most panelists had expertise across multiple grade bands, and some had certification in both an academic subject and special education. Panels completed training and calibration activities prior to making independent ratings. Panels discussed ratings until consensus when there was not an initial majority agreement.
Panels identified the lowest grade in which students who achieve At Target on the DLM alternate assessment are at least 80% likely to be able to demonstrate each skill, showing the first point of readiness to pursue postsecondary opportunities that require the least complex application of academic skills. In ELA, students achieving At Target are expected to first demonstrate 96% of those skills by Grade 5. In mathematics, students meeting achievement standards are expected to first demonstrate 72% of the academic skills by Grade 5 and 24% of skills in middle grades (Grades 6–8).
Overall, findings from panels indicate that most academic skills needed to pursue postsecondary opportunities are first associated with meeting the DLM academic achievement expectations in earlier grades (i.e., 3–5). Given the vertical alignment of the DLM academic achievement standards, students who achieve At Target in early grades further develop these skills so that, by the time they leave high school, they are ready to pursue postsecondary opportunities that require more complex applications of the academic skills.
Panelists also participated in focus groups to share their perceptions of opportunities, skills, and expectations for students with significant cognitive disabilities. Panelists believed the academic skills were important to postsecondary opportunities for all students, not only those who take the DLM assessment. Panelists indicated that students who were At Target in high school on the DLM assessment were likely to possess the needed academic knowledge, skills, and understandings to pursue a range of postsecondary opportunities.
Evaluation of panelists’ experiences from both panels and DLM TAC members’ review of the processes and evaluation of results provide evidence that the methods and processes used achieved the goals of the study. See Karvonen et al. (2020) for the full version of the postsecondary opportunities technical report. Overall, this evidence shows that students who demonstrate proficiency on DLM assessments are on track to pursue postsecondary opportunities.
7.5 Data Files
DLM assessment results were made available to DLM state education agencies following the 2021–2022 administration. The General Research File (GRF) contained student results, including each student’s highest linkage level mastered for each EE and final performance level for the subject for all students who completed any testlets. In addition to the GRF, the states received several supplemental files. The special circumstances file provided information about which students and EEs were affected by extenuating circumstances (e.g., chronic absences), as defined by each state. State education agencies also received a supplemental file to identify exited students. The exited students file included all students who exited at any point during the academic year. In the event of observed incidents during assessment delivery, state education agencies are provided with an incident file describing students impacted; however, no incidents occurred during 2021–2022.
State education agencies were provided with a 2-week window following data file delivery to review the files and invalidate student records in the GRF. Decisions about whether to invalidate student records are informed by individual state policy. If changes were made to the GRF, state education agencies submitted final GRFs via Educator Portal. The final GRF was used to generate score reports.
7.6 Score Reports
Assessment results were provided to state education agencies to report to parents/guardians, educators, and local education agencies. Individual Student Score Reports summarized student performance on the assessment by subject. Several aggregated reports were provided to state and local education agencies, including reports for the classroom, school, district, and state.
7.6.1 Individual Student Score Reports
Individual Student Score Reports were developed through a series of focus groups, including a set conducted in partnership with The Arc, a community-based organization advocating for and serving people with intellectual and developmental disabilities and their families. First, several groups focused on parent/guardian perceptions of existing alternate assessment results and score reports (Nitsch, 2013). These findings informed the development of prototype DLM score reports. Prototypes were reviewed by the DLM Governance Board and revised based on multiple rounds of feedback. Refined prototypes were shared with parents/guardians, advocates, and educators through additional focus groups (Clark et al., 2015) before finalizing the 2015 reports.
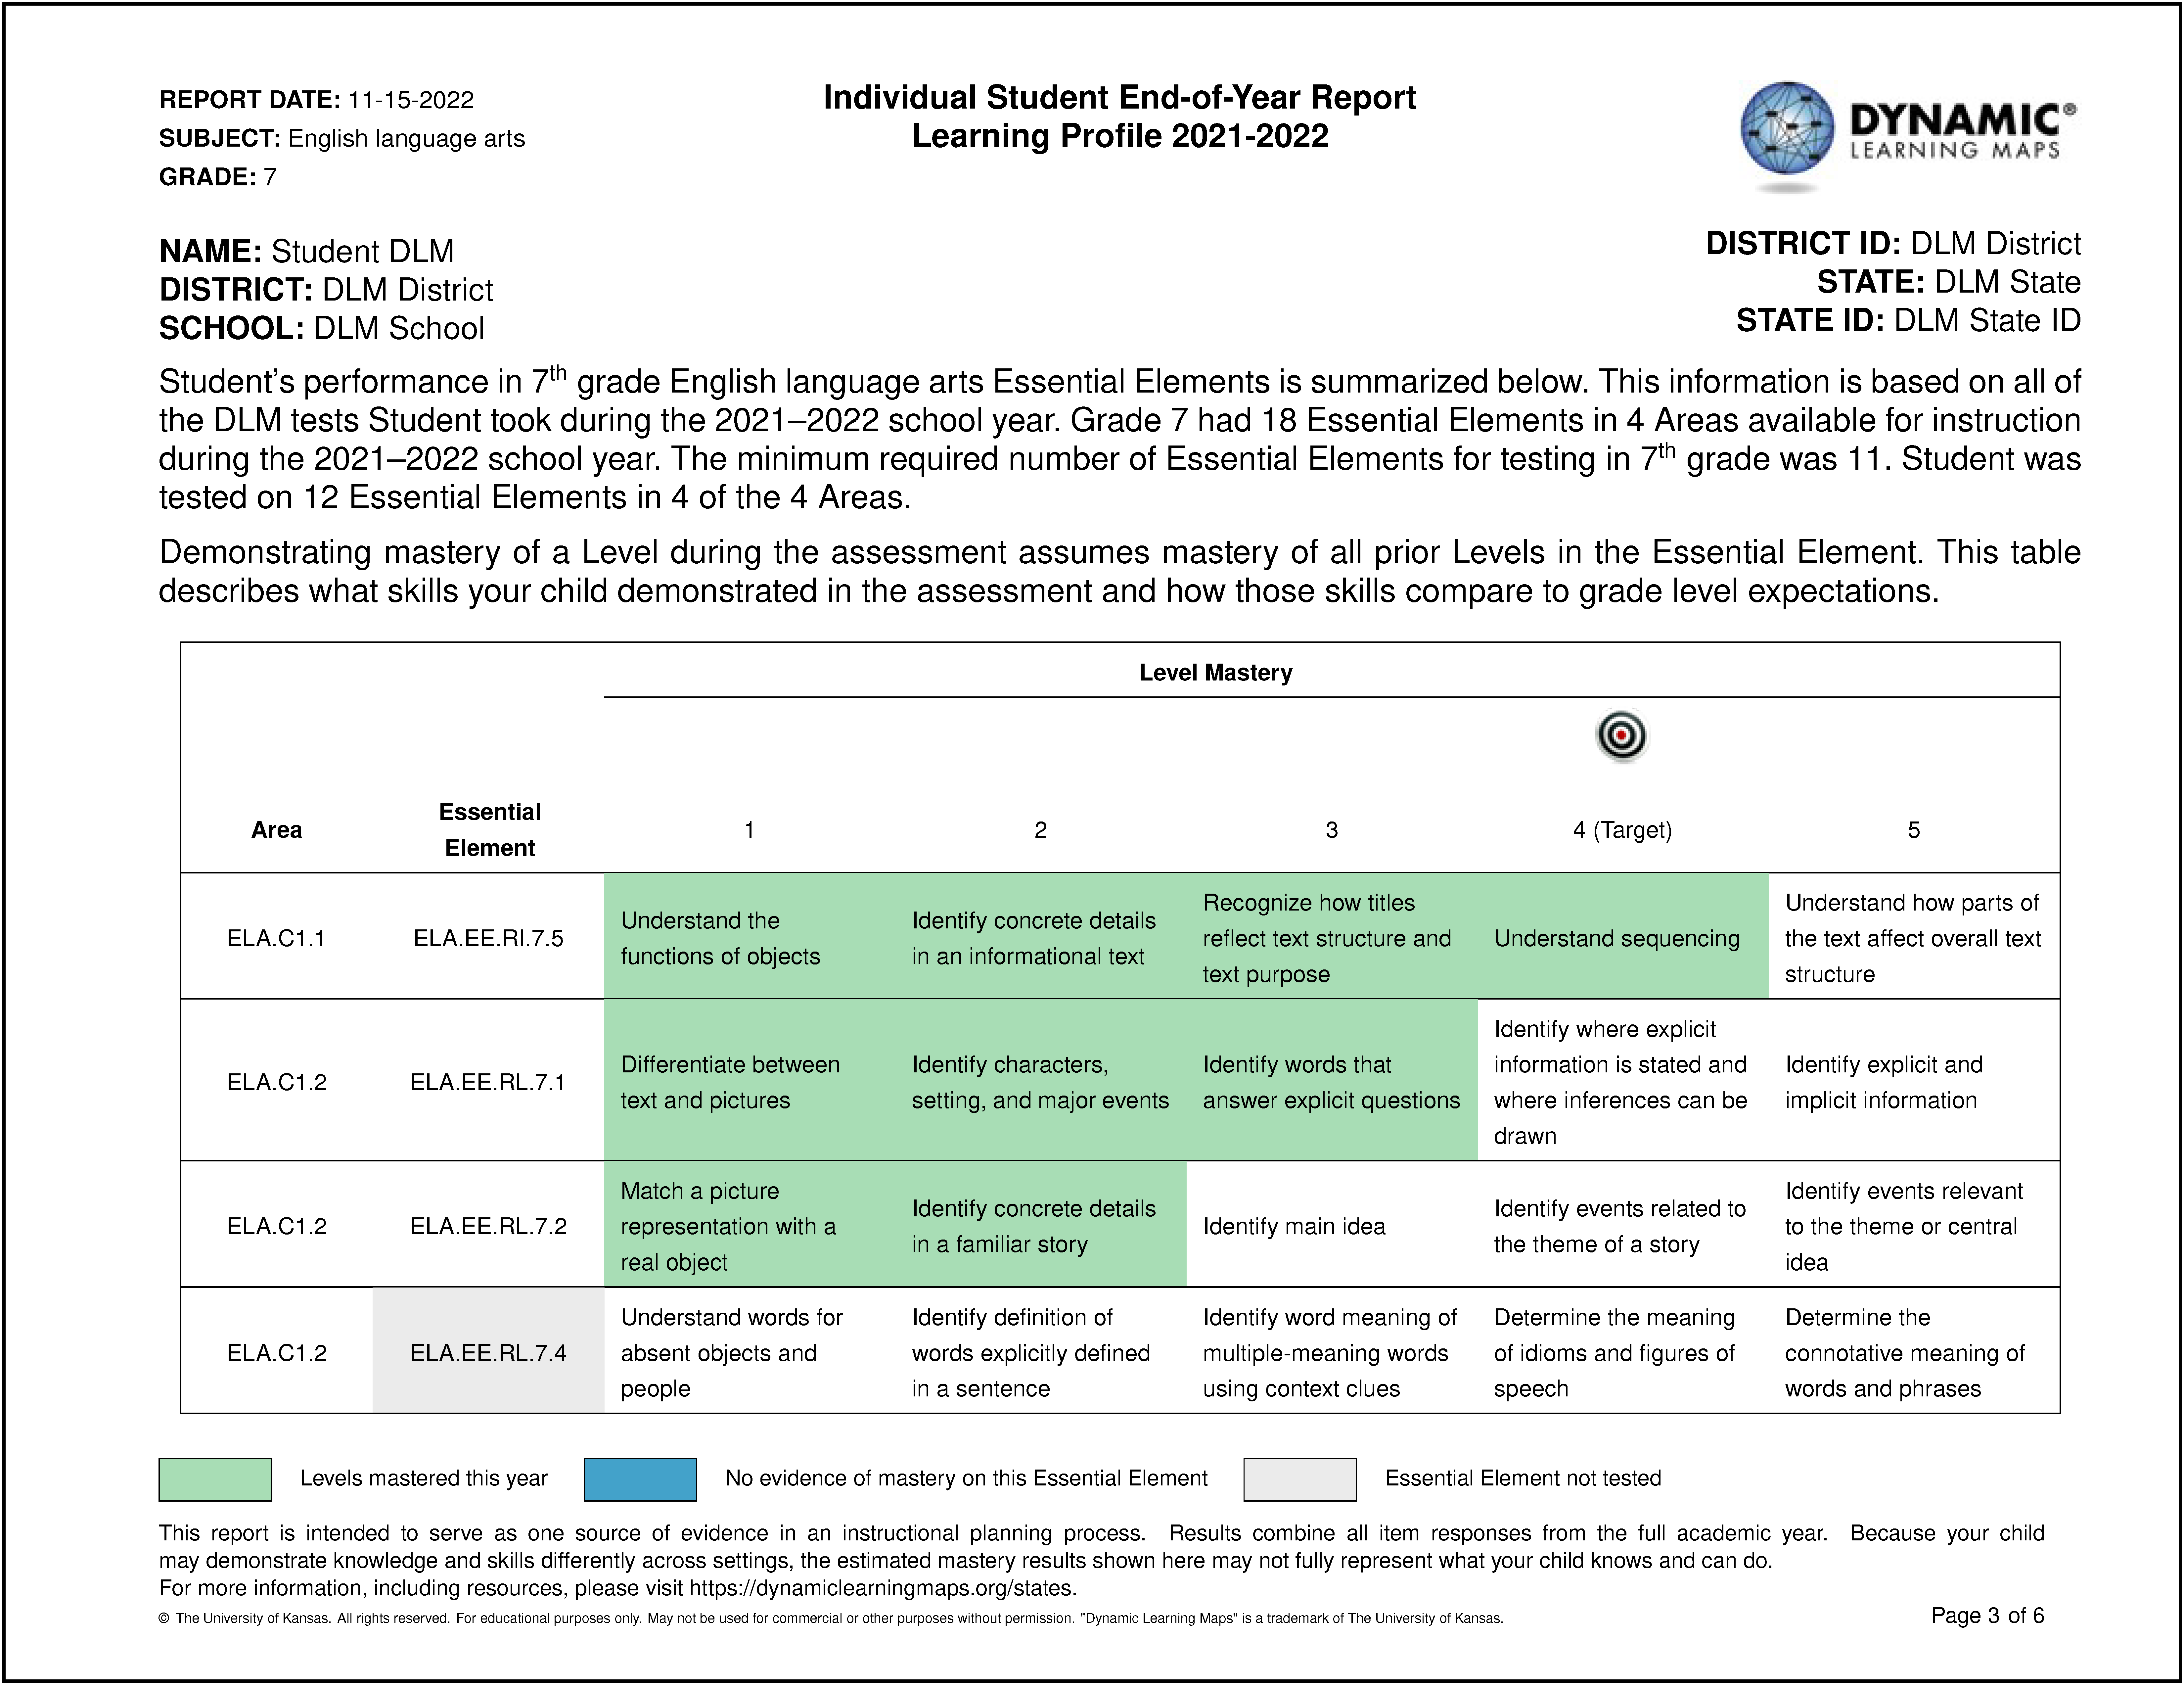
Individual Student Score Reports are comprised of two parts: (1) the Performance Profile, which aggregates linkage level mastery information for reporting performance in the subject overall and on each conceptual area or claim, and (2) the Learning Profile, which reports specific linkage levels mastered for each assessed EE. There is one Individual Student Score Report per student per subject. Figure 7.3 and Figure 7.4 display a sample page from the Performance Profile and Learning Profile for ELA, respectively.
Figure 7.3: Sample Page of the Performance Profile for ELA
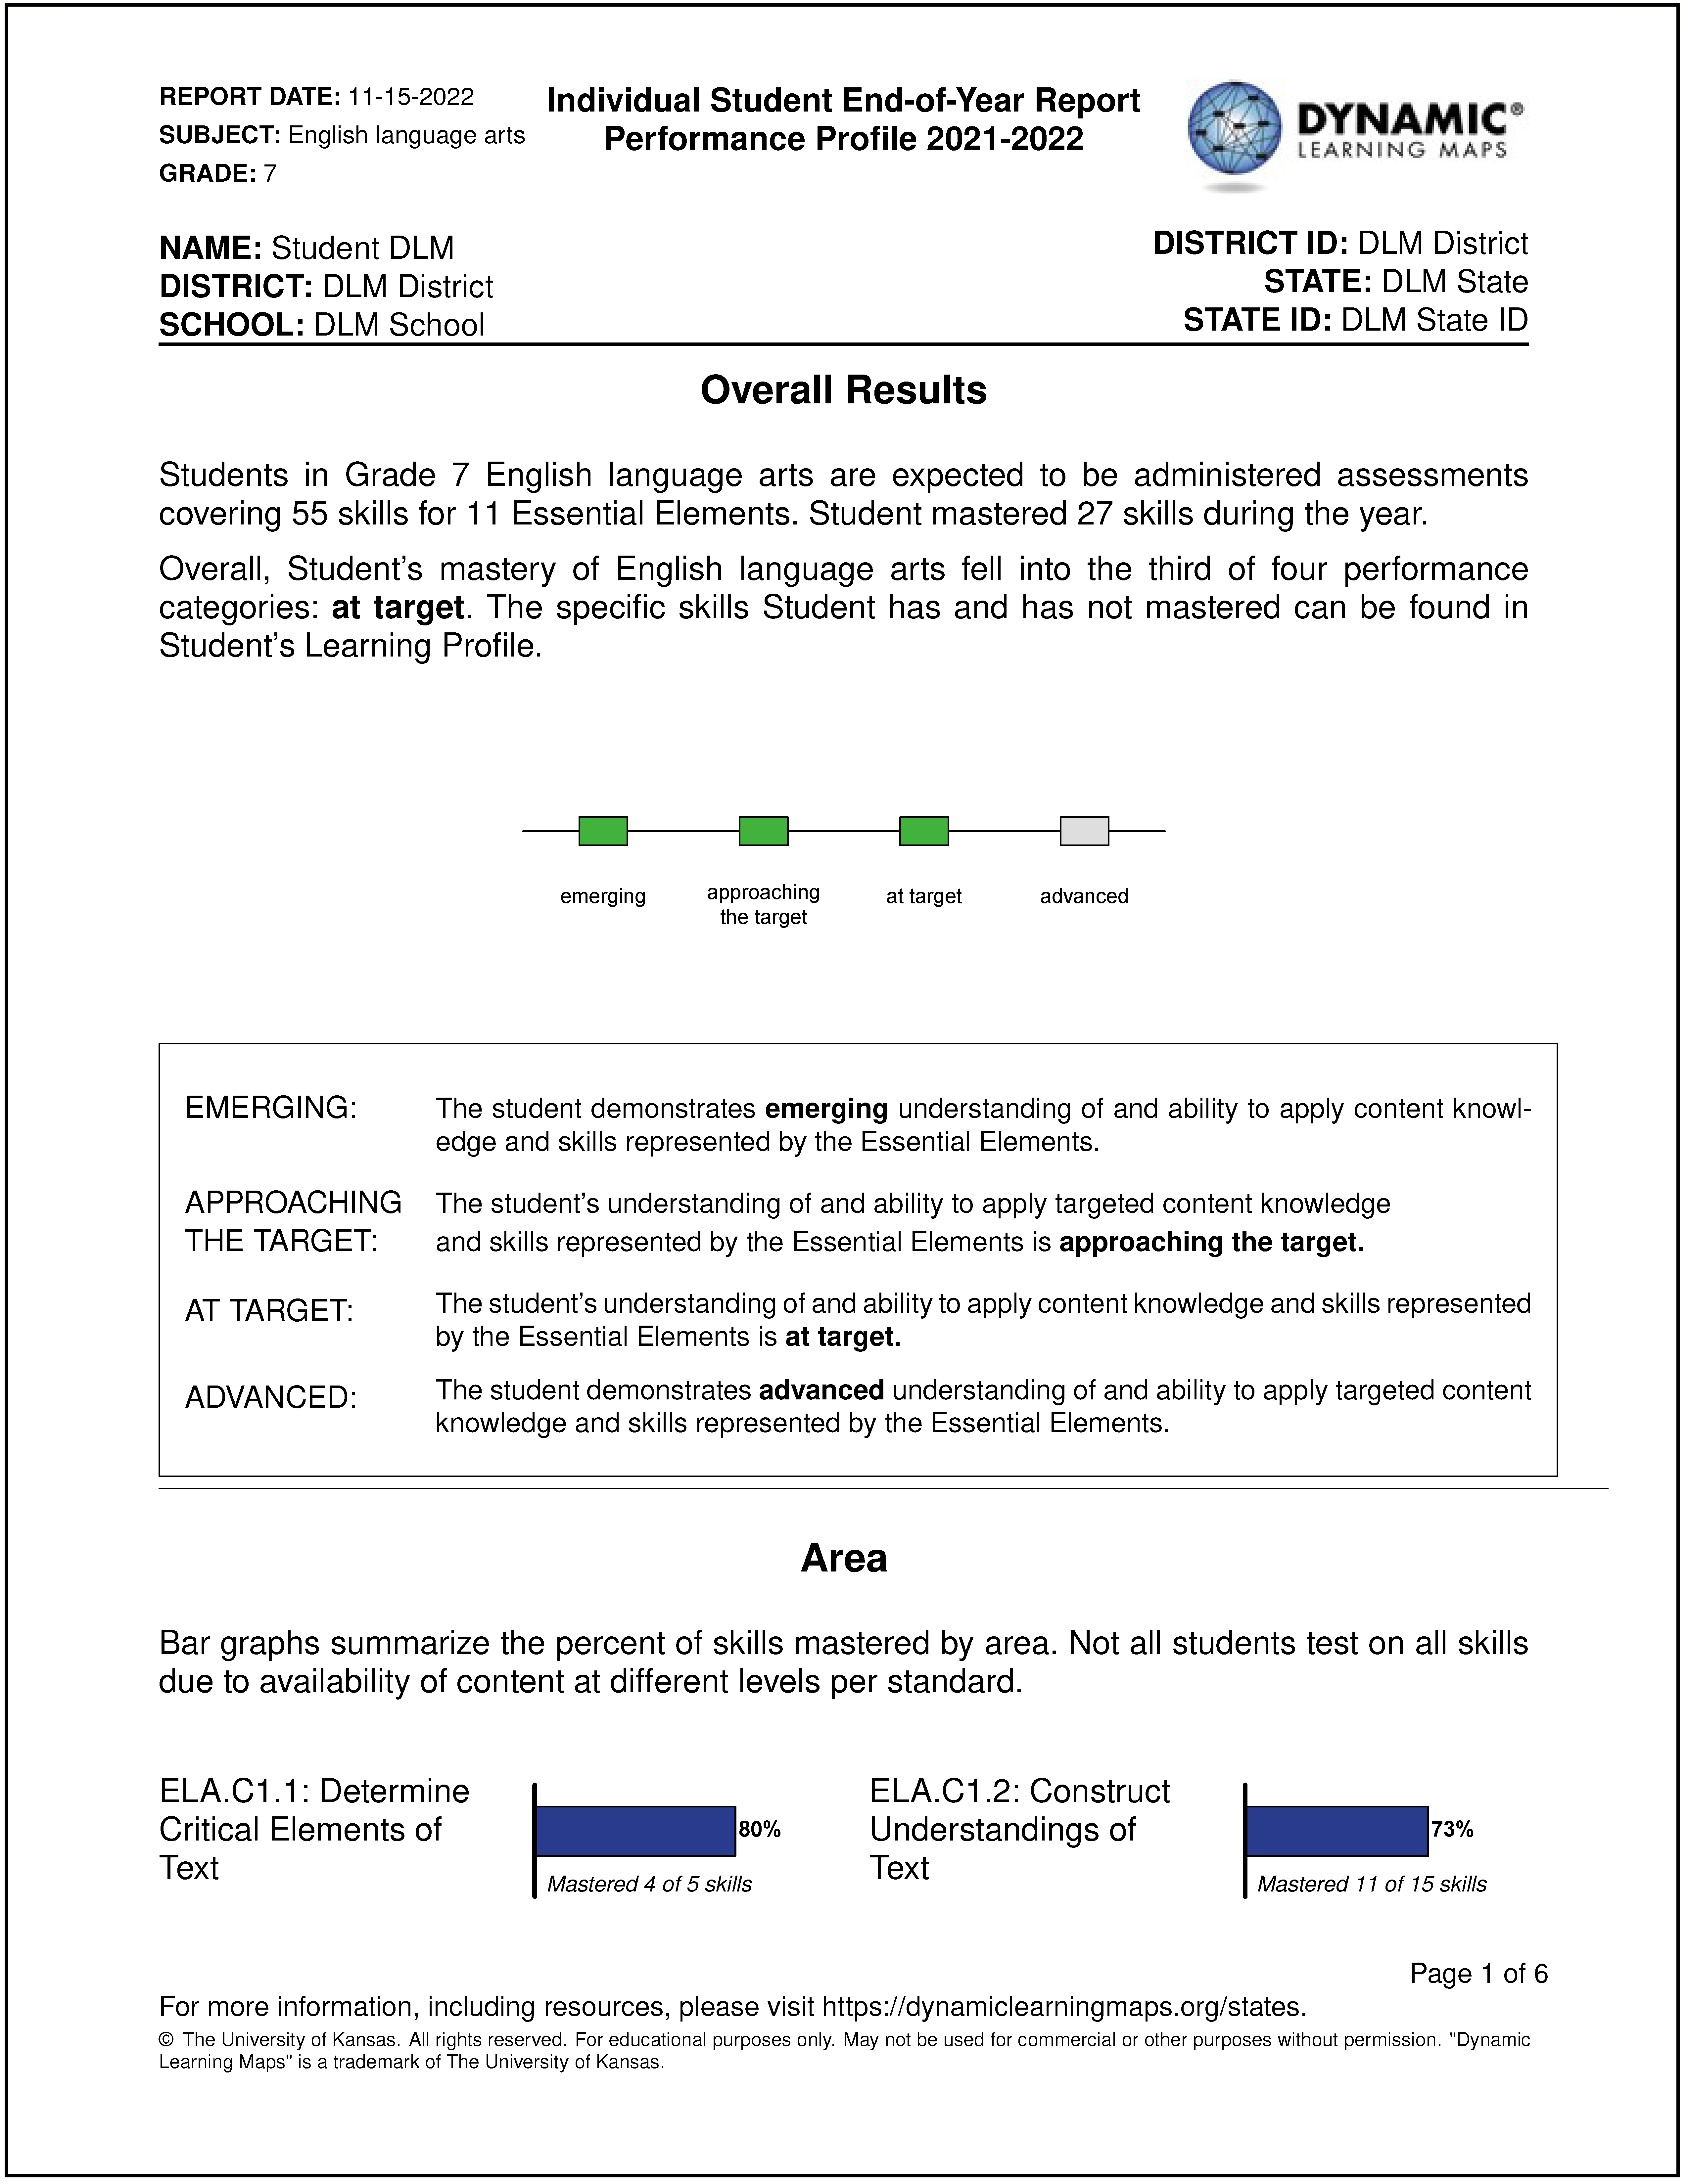
Figure 7.4: Sample Page of the Learning Profile for ELA
Additional interviews and focus groups with DLM educators provided evidence of score report effectiveness and yielded additional information for refining score reports (Clark et al., 2018; Karvonen et al., 2016; Karvonen et al., 2017). These studies indicated educators were able to appropriately interpret score report contents, found them instructionally useful, and used them to reflect on their instructional decisions. Educators also suggested additional improvements, for instance, to improve clarity of language. Minor adjustments to score report structure is implemented on an annual basis based on feedback from the field and input from the DLM scoring and reporting ad hoc committee and the larger DLM Governance Board. Sample reports for 2021–2022 are displayed in the Scoring and Reporting Resources webpage (http://dynamiclearningmaps.org/srr/ie-2022). This page contains an overview of scoring, score report delivery, and data files. Because of continued impacts of the COVID-19 pandemic on instruction and assessment, during 2021–2022, state education agencies were given the option to add a cautionary statement to Individual Student Score Reports, which indicated that the results may reflect the continued effects of the COVID-19 pandemic on student performance. However, no states using the instructionally embedded model opted to include the cautionary statement on their individual student score reports.
7.6.2 Aggregate Reports
Student results are also aggregated into several other types of reports. At the classroom and school levels, roster reports list individual students with the number of EEs assessed, number of linkage levels mastered, and final performance level. District- and state-level reports provide frequency distributions, by grade level and overall, of students assessed and achieving at each performance level in ELA and mathematics. Sample aggregate reports are provided in the Scoring and Reporting Resources webpage (http://dynamiclearningmaps.org/srr/ie-2022).
7.6.3 Interpretation Resources
At the onset of the DLM assessment, the Theory of Action for the assessment set forth four tenets for score interpretation and use:
- Scores represent what students know and can do.
- Performance level descriptors provide useful information about student achievement.
- Inferences regarding student achievement and progress can be drawn for individual conceptual areas or claims.
- Assessment scores provide information that can be used to guide instructional decisions.
To these ends, multiple supports are provided to aid score interpretation:
- The Parent Interpretive Guide is designed to provide definition and context to student score reports.
- Parent/guardian letter templates are designed to be used by educators and state superintendents to introduce the student reports to parents/guardians.
- The Talking with Parents Guide is designed to support educators’ discussions and build understanding for parents/guardians and other stakeholders.
- The Scoring and Reporting Guide for Administrators targets building- and district-level administrators.
- A set of four short score-report interpretation videos, known as helplets, are available to help key stakeholders interpret assessment results as intended.
- All of the resources listed above and described in further detail below are compiled on the Scoring and Reporting Resources webpage (http://dynamiclearningmaps.org/srr/ie-2022). The score report videos are available on the “DLM Score Report Videos for Instructionally Embedded States” webpage (https://dynamiclearningmaps.org/score-report-videos-ie).
7.6.3.1 Parent Interpretive Guide
The Parent Interpretive Guide uses a sample individual student report and text boxes to explain that the assessment measures student performance on alternate achievement standards for students with the most significant cognitive disabilities—the DLM EEs. The guide first provides a high-level explanation of the DLM alternate assessment before delving into specifics about interpreting the Performance Profile and the Learning Profile.
7.6.3.2 Parent Letters
Templates were developed for explanatory letters that educators and state superintendents could use to introduce parents/guardians to the student reports. These letters provided context for the reports, including a description of the DLM assessment, when the assessment was administered, and what results indicate about student performance.
The letter from the state superintendent emphasized that setting challenging and achievable academic goals for each student is the foundation for a successful and productive school year. The letter acknowledged that students have additional goals that parents/guardians and the students’ Individualized Education Plan teams have established.
7.6.3.3 Talking with Parents Guide
An interpretive guide was provided for educators who would discuss results with parents/guardians or other stakeholders. The guide walked educators through directions for getting ready for a parent/guardian meeting, discussing the score report, and explaining other aspects of the DLM assessment.
7.6.3.4 Guide to Scoring and Reporting for Data Managers
The guide designed for local administrators, such as superintendents, district test coordinators, and other district staff, covered how assessment results were calculated and each type of report provided for DLM assessments (including class- and school-level results as well as district- and state-level results) and explained how reports would be distributed. The guide explained the contents of each report and provided hints about interpretation.
7.6.3.5 Score Report Videos
Short videos, called helplets, found on the DLM website describe score report contents and ways educators can use results to inform instruction. The video content went through multiple rounds of internal review, followed by TAC review, and external review by educators from six states. Feedback from each group was incorporated into the final videos. The available helplets are:
- What do the DLM Alternate Assessments Measure?
- What is Skill Mastery?
- What Information is Contained in a Score Report?
- How can Score Reports be Used?
7.7 Quality-Control Procedures for Data Files and Score Reports
Quality-control procedures are implemented for all three data file types. To ensure that formatting and the order of columns are identical, column names in each file were compared with the data dictionary that is provided to states. Additional file-specific checks are conducted to ensure accuracy of all data files.
To allow quality-control checks to be performed more rapidly and efficiently, R programs were developed to perform quality-control procedures on the GRF and on Individual Student Score Reports.
The first program written to perform automated checks is designed to perform quality-control on the GRF. This program conducts a series of checks that can be organized into four main steps.
- Check the data for reasonableness (checks described below).
- Ensure the number of linkage levels mastered for each student is less than or equal to the maximum possible value for that grade and subject.
- Check all EE scores against the original scoring file.
- Ensure all necessary fields are present and in the correct order. The automated program checks each row of data in the GRF and generates errors for review by the psychometrics team.
The reasonableness checks ensure that the GRF column names accurately match the data dictionary provided to states and check the columns to ensure that data match defined parameters. If invalid values are found, they are corrected as necessary by DLM staff and/or state education agencies during their 2-week review period.
An automated program is used to support manual review of all Individual Student Score Reports. The program was written to check key values used to generate Individual Student Score Reports. As the program generates reports, it creates a proofreader file containing the values that are used to create each score report. These values are then checked against the GRF to ensure that they are being accurately populated into score reports.
Demographic values including student name, school, district, grade level, state, and state student identifier are checked to ensure a precise match. Values of skills mastered, performance levels, conceptual areas or claims tested and mastered, and EEs mastered and tested are also checked to ensure the correct values are populated. Values referring to the total number of skills, EEs, or conceptual areas and claims available are checked to ensure they are the correct value for that grade and subject. In addition to the data files, individual student and aggregated score reports are generated within Kite® Educator Portal and checked for quality. Given the large number of score reports generated, a random sample of approximately 5%–10% of the score reports generated are checked manually.
For this sample, both the Performance Profile and the Learning Profile portions of the Individual Student Score Reports are checked for accuracy. Performance Profiles are checked to make sure the correct performance level displayed and matched with the value in the GRF. The percentage of skills mastered in the Performance Profile is compared against the GRF and the Learning Profile portion of the student score report to ensure that all three contain the same values. Additionally, the number of conceptual areas or claims listed in the Performance Profile is compared with the blueprint. For each EE on the student’s Learning Profile, the highest linkage level mastered is compared with the value for the EE in the GRF. For both the Performance Profile and Learning Profile, the number of EEs listed on the report is compared against the number listed in the blueprint for that subject and grade. Demographic information in the header of the Performance Profile and Learning Profile is checked to ensure that it matches values in the GRF. Formatting and text within each report is given an editorial review as well.
Aggregated reports undergo similar checks, including the comparison of header information to GRF data and verification that all students rostered to an educator or school (for class and school reports, respectively) are present and that no extraneous students are listed. Performance levels (for class and school reports) and the number of students with a given performance level (for district and state reports) are checked against the GRF.
Once all reports are checked, all files to be disseminated to states undergo a final set of checks to ensure that all files are present. This last set of checks involves higher-level assurances that the correct number of student files are present for each type of report according to the expected number calculated from the GRF, that file naming conventions are followed, and that all types of data files are present.
Any errors identified during quality-control checks are corrected prior to distribution of data files and score reports to states.
7.8 Conclusion
Results for DLM assessments include students’ overall performance levels and linkage level mastery decisions for each assessed EE and linkage level. During 2021–2022, assessments were administered to 13,641 students in 6 states. Between 8% and 41% of students achieved at the At Target or Advanced levels across all grades and subjects. Of the three scoring rules, linkage level mastery status was most frequently assigned by the diagnostic classification model, and students tend to demonstrate mastery of the Target or Successor level at higher rates in ELA than in mathematics. Additional scoring evidence indicates that writing tasks are reliably scored by test administrators, and students who achieve at the At Target performance level are on track to pursue postsecondary opportunities.
Following the 2021–2022 administration, three data files were delivered to state education agencies: GRF, special circumstance code file, and exited students file. Score reports summarized assessment results at the individual student, class, school, district, and state levels. Supplementary materials to support score report interpretation and use are available on the DLM website.