3 Assessment Design and Development
Dynamic Learning Maps® (DLM®) assessments measure student knowledge and skills using items organized into short testlets. This chapter describes how assessment content is developed and evaluated.
The chapter describes DLM assessments and how they were developed using principles of Evidence-Centered Design (ECD) and Universal Design for Learning (UDL). The chapter first describes the design of English language arts (ELA) reading and writing testlets, as well as mathematics testlets, and alternate testlets for students who are blind or have visual impairments. The chapter then provides information on the test development process, including item writing, and external reviews for content, bias, and accessibility. The chapter then presents evidence of the alignment of linkage level nodes to assessed items and evidence of students’ response processes when engaging with assessment content. The chapter concludes by presenting evidence of item quality, including a summary of field-testing data analysis and associated reviews, a summary of the pool of operational testlets available for administration, and an evaluation of differential item functioning.
3.1 Assessment Structure
As discussed in Chapter 2 of this manual, the DLM Alternate Assessment System uses learning maps as the basis for assessment, which are highly connected representations of how academic skills are acquired as reflected in research literature. Nodes in the maps represent specific knowledge, skills, and understandings in ELA and mathematics, as well as important foundational skills that provide an understructure for the academic skills. The maps go beyond traditional learning progressions to include multiple pathways by which students develop content knowledge and skills.
Four broad claims were developed for ELA and mathematics, which were then subdivided into nine conceptual areas, to organize the highly complex learning maps (see Chapter 2 of this manual). Claims are overt statements of what students are expected to learn and be able to demonstrate as a result of mastering skills within a very large neighborhood of the map. Conceptual areas are nested within claims and comprise multiple conceptually related content standards, and the nodes that support and extend beyond the standards. The claims and conceptual areas apply to all grades in the DLM System.
Essential Elements (EEs) are specific statements of knowledge and skills, analogous to alternate or extended content standards. The EEs were developed by linking to the grade-level expectations identified in the Common Core State Standards (see Chapter 2 of this manual). The purpose of the EEs is to build a bridge from the Common Core State Standards to academic expectations for students with the most significant cognitive disabilities.
For each EE, five linkage levels—small collections of nodes that represent critical junctures on the path toward and beyond the learning target—were identified in the map. Assessments are developed at each linkage level for a particular EE.
Testlets are the basic units of measurement in the DLM System. Testlets are short, instructionally relevant measures of student skills and understandings. Students take a series of testlets to achieve blueprint coverage.
Each testlet is made up of three to nine assessment items. Assessment items were developed based on nodes at the five linkage levels for each EE. Each testlet measures an EE and linkage level, with the exception of writing testlets. The Target linkage level reflects the grade-level expectation aligned directly to the EE. For each EE, small collections of nodes are identified earlier in the map that represent critical junctures on the path toward the grade-level expectation. Nodes are also identified beyond the Target to give students an opportunity to grow toward the grade-level targets for students without significant cognitive disabilities.
There are three levels below the Target and one level beyond the Target.
- Initial Precursor
- Distal Precursor
- Proximal Precursor
- Target
- Successor
3.2 Items and Testlets
In reading and mathematics, testlets are based on nodes for one linkage level of one EE. Writing testlets measure multiple EEs and linkage levels. Each testlet contains three to nine items. All testlets begin with a nonscored engagement activity, which includes a stimulus related to the assessment designed to help the student focus on the task at hand. In ELA, the engagement activity for reading testlets is a story or informational text.
Several item types are used in DLM testlets. While most types are used in both ELA and mathematics testlets, some types are used only in testlets for one subject. The following item types are used in DLM testlets:
- Multiple-choice single-select
- Multiple-choice multiple-select
- Select text (ELA only)
- Matching lines (mathematics only)
Most items within the testlets are multiple-choice single-select items with three answer options presented in a multiple-choice format using either text or images. Technology-enhanced items (i.e., not multiple choice with a single correct response) are used on a limited basis due to the additional cognitive load they can introduce. Some assessed nodes in the DLM maps require complex cognitive skills such as sorting or matching that are difficult to assess efficiently in a multiple-choice format while keeping the length of the assessment constrained. In these cases, technology-enhanced items that matched the construct described by the nodes were used to avoid having to use many multiple-choice items to assess the same construct. Evidence for the accessibility and utility of technology-enhanced items was collected from item tryouts and cognitive labs, which are described later in this chapter, in section 3.5.
There are two general modes for DLM testlet delivery: computer-delivered and educator-administered. Computer-delivered assessments are designed so students can interact independently with the computer, using special assistive technology devices such as alternate keyboards, touch screens, or switches as necessary. Computer-delivered testlets emphasize student interaction with the content of the testlet, regardless of the means of physical access to the computer. Therefore, the contents of testlets, including directions, engagement activities, and items, are presented directly to the student. Educators may assist students during these testlets using procedures described in Chapter 4 of this manual.
Educator-administered testlets are designed for the educator to administer outside the system, with the test administrator recording responses in the system rather than the student recording their own responses. These educator-administered testlets include onscreen content for the test administrator that begins by telling, in a general way, what will happen in the testlet. Directions for the test administrator then specify the materials that need to be collected for administration. After the educator direction screen(s), educator-administered testlets include instructions for the engagement activity. After the engagement activity, items are presented. All educator-administered testlets have some common features:
- Directions and scripted statements guide the test administrator through the administration process.
- The engagement activity involves the test administrator and student interacting directly, usually with objects or manipulatives.
- The test administrator enters responses based on observation of the student’s behavior.
Testlet organization, the type of engagement activity, and the type and position of items vary depending on the intended delivery mode (computer-administered or educator-administered) and content being assessed (reading, writing, or mathematics). Specific descriptions and examples of the structure of testlets, engagement activities, and different item types are included in the following sections related to reading, writing, and mathematics testlets.
3.2.1 English Language Arts Reading Testlets
ELA reading testlets are built around texts adapted from or related to grade-level–appropriate general education texts. Short narrative texts are constructed from books commonly taught in general education, and short informational texts are written to relate to thematic elements from narratives. All texts are deliberately written to provide an opportunity to assess specific nodes in the maps associated with different EEs and linkage levels. Text complexity for narrative texts is reduced from the grade-level texts for non-DLM students, focusing on core vocabulary, simple sentence structure, and readability. See section 3.3.4 of this chapter for a complete description of ELA texts.
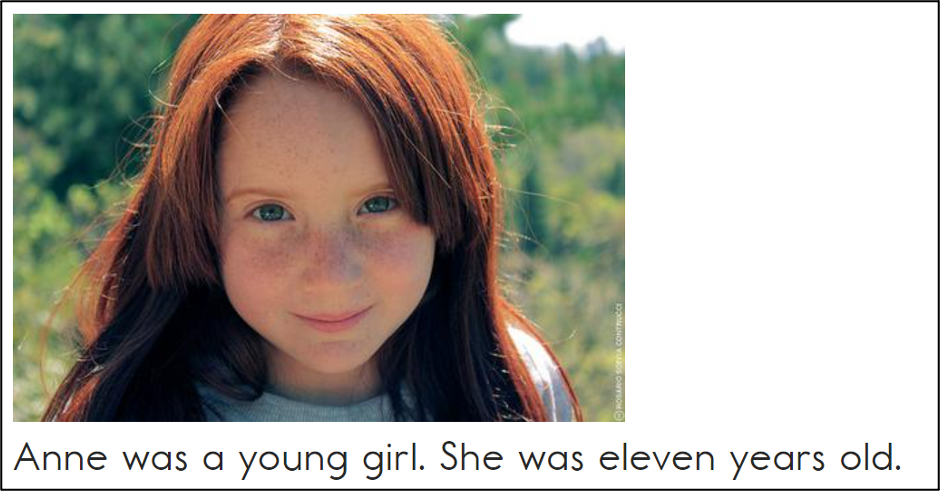
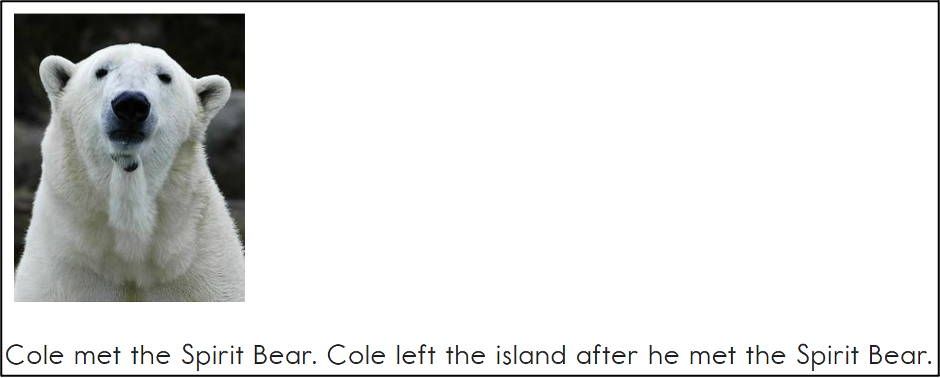
ELA Claim 1 states, “Students can comprehend text in increasingly complex ways.” To provide access to a wide range of student needs, the complexity of the text is held relatively constant, but the complexity of cognitive tasks needed to answer items is increased. Texts are generally very brief, typically between 50 and 200 words in length. Texts are presented with 1–3 sentences on a screen with an accompanying image. One screen is presented at a time. Students and educators can navigate forward and backward between screens. ELA texts contain between 6 and 25 screens.
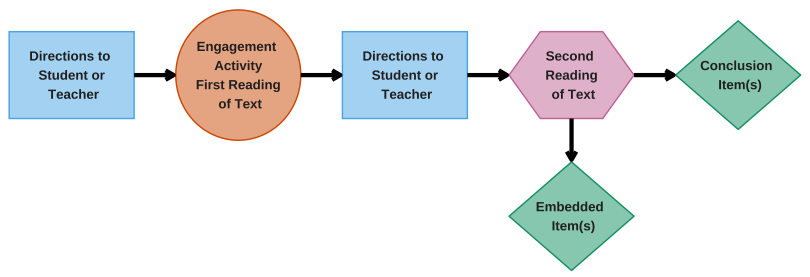
ELA reading testlets follow a basic structure, with variations for some educator-administered testlets or testlets assessing nodes that require students to compare more than one text. Figure 3.1 shows the elements of an ELA reading testlet. An ELA reading testlet begins with directions to the student in computer-delivered testlets, or to the test administrator in educator-administered testlets, followed by an engagement activity. The engagement activity consists of the first reading of the story or text that allows students to read, become familiar with, and comprehend the story or text before responding to any items. After the first reading, directions to the student or educator explain that the story or text is complete and that next, students will re-read the text and respond to some questions. After these directions, the student begins the second reading. The second reading is presented the same as the first reading, but with assessment items embedded into the text. Embedded items are placed between the screens of the text, and conclusion items appear after the second reading of the text is complete.
Figure 3.1: Elements of an English Language Arts Reading Testlet
3.2.1.1 Engagement Activities
ELA reading testlets include an engagement activity that outlines the structure of the testlet and instructs the student and/or test administrator how to proceed through the testlet. In reading testlets, the first reading of the text is considered a part of the engagement activity. In computer-delivered testlets, the engagement activity instructs students to read the text. Students may read on their own or with read-aloud support as a selected accessibility support (see Chapter 4 of this manual). An example of a computer-delivered engagement activity screen is shown in Figure 3.2.
Figure 3.2: Example of an English Language Arts Computer-Delivered Reading Engagement Activity Screen
Educator-administered testlets require the test administrator to assess the student outside the online testing platform and enter responses. In educator-administered testlets, the engagement activity introduces the testlet to the test administrator, who will read the story or text with the student. For educator-administered ELA reading testlets, the engagement activity is also the first reading of the text. The directions for the engagement activity are presented to the test administrator. An example of an educator-administered engagement activity screen is shown in Figure 3.3.
Figure 3.3: Example of an English Language Arts Educator-Administered Reading Engagement Activity Screen
3.2.1.2 Second Reading of Text
The decision to use two readings of the same text in each reading testlet was made in consideration of Cognitive Load Theory. Within the context of instructional and assessment design, the application of Cognitive Load Theory emphasizes decreasing the memory storage demands in order to emphasize processing components of the activity (Chandler & Sweller, 1991). Thompson, Johnstone, and Thurlow (2002) describe a set of strategic processes aligned with UDL that can be seen as a way to reduce the extraneous cognitive load for students with disabilities. The approach adopted for reading testlets was intended to reduce the demands on student working memory by providing an opportunity to read a text and then immediately read it again, embedding items into the second reading between screens that present the text. Examples of the skills and processes assessed by the embedded items include
- identifying features of texts,
- identifying details in texts,
- finding specific words in texts, and
- identifying relationships described in texts.
The use of embedded items means that rather than having students read a story once and then recall how a character felt at some prior point in the story, the embedded question is presented when the character’s feeling state is active in working memory.
Conclusion items are presented after the conclusion of the second reading of the text. These items focus on products of comprehension or assessments of elements that depend on a representation of the entire text. Examples of the skills and products that conclusion items focus on include
- identifying the theme and/or main idea(s) of a text,
- identifying structural elements of an entire text (e.g., beginning, middle, end),
- comparing multiple texts, and
- analyzing purpose, evidence, or goals in a text.
Testlets can include a mixture of embedded and/or conclusion items.
3.2.1.3 Items
Computer-delivered ELA reading testlets contain three item types: multiple choice, multiple-choice multiple-select, and select-text. Technology-enhanced items such as select-text are used when nodes at certain linkage levels would be difficult to assess using a multiple-choice item. Items of all three types can be embedded or conclusion items. Educator-administered ELA reading testlets use only multiple-choice items.
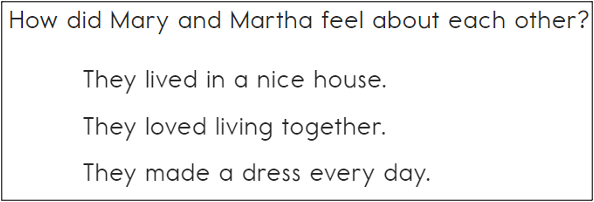
For many multiple-choice items, the stem is a question related to the text. For others, the stem includes a line from the story or text followed by a question. Most multiple-choice items contain three answer options, one of which is correct. Students may select only one answer option. Most answer options are words, phrases, or sentences. For items that evaluate certain map nodes, answer options are images. An example of an ELA multiple-choice item with text answer options is shown in Figure 3.4.
Figure 3.4: Example of an English Language Arts Computer-Delivered Multiple-Choice Item
For multiple-choice multiple-select items, the item stem directs the student to select answers from four answer options, where more than one is correct. Answer options are words, phrases, or sentences. Multiple-choice multiple-select items allow students to choose up to four answer options. An example of an ELA multiple-choice multiple-select item is shown in Figure 3.5.
Figure 3.5: Example of an English Language Arts Computer-Delivered Multiple-Choice Multiple-Select Item
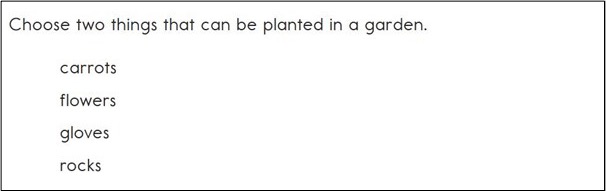
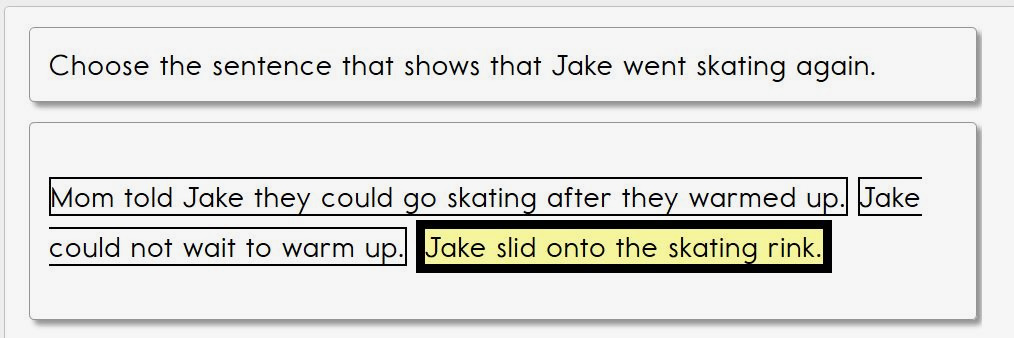
Select-text items direct students to select an answer from a passage taken from the story or text. In Figure 3.6, the student chose the appropriate sentence from a short passage. The stem is a directive to the student to select a word, phrase, or sentence from the passage. Certain words have a box around them to indicate they are answer options. When a student selects a word, phrase, or sentence, it becomes highlighted in yellow.
Figure 3.6: Example of an English Language Arts Select-Text Item
3.2.2 English Language Arts Writing Testlets
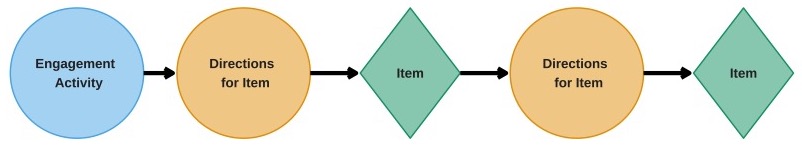
Writing testlets measure multiple EEs and linkage levels. All ELA writing testlets are educator-administered. For writing testlets, the test administrator engages in a scripted activity with a student outside the online testing platform and then enters observations and evaluation of the student’s writing process and product into the online testing platform. Figure 3.7 shows the structure of a writing testlet. The testlet begins with an engagement activity and provides directions for the test administrator for each item before the item is presented.
Figure 3.7: Elements of an English Language Arts Writing Testlet
Every grade has an Emergent and Conventional writing testlet. Emergent writing describes the marks, scribbles, and random selection of letters seen in beginning writers (Erickson et al., 2010). The DLM EEs focus on having students work toward an understanding of writing as a form of communication and the ability to write about information. Emergent writing testlets focus on nodes in the map that are identified as being important precursor skills on the way toward conventional writing. Conventional writing includes methods of writing that use orthography (letters, words) assembled in ways that are meaningful to others. Key conceptual components of conventional writing include an understanding that words comprise letters, that words have meanings, and that written words can be put together to communicate to others. Key behaviors associated with conventional writing include writing letters and words using a traditional writing tool or alternate pencil.
3.2.2.1 Engagement Activities
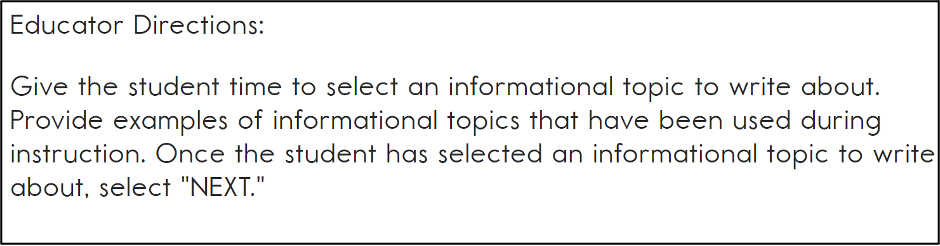
Writing testlets begin with a materials screen that lists materials the student will need to complete the testlet, instructions to the test administrator about administering the testlet, and instructions to the test administrator on administrating an engagement activity that outlines how students should choose an object or topic to write about. Test administrators are directed to engage the student in thinking about a topic to encourage recall of relevant prior knowledge before a student begins to write. These instructions provide guidance to the test administrator on allowing the student to select an object to use or topic to write about as they complete the items in the writing testlet. Figure 3.8 shows an example.
Figure 3.8: Example of an English Language Arts Writing Engagement Activity
3.2.2.2 Items
In writing testlets, the engagement activity is followed by items that require the test administrator to evaluate the student’s writing process. Some writing testlets also evaluate the student’s writing product, and these product items occur at the end of the testlet. Process and product items are multiple-choice single-select or multiple-choice multiple-select items with answer choices. Educators evaluate samples for easily perceptible text features requiring minimal inference, such as correct syntax, spelling, capitalization, and punctuation. Both item types ask test administrators to select a response from a checklist of possible responses that best describes what the student did or produced as part of the writing testlet.
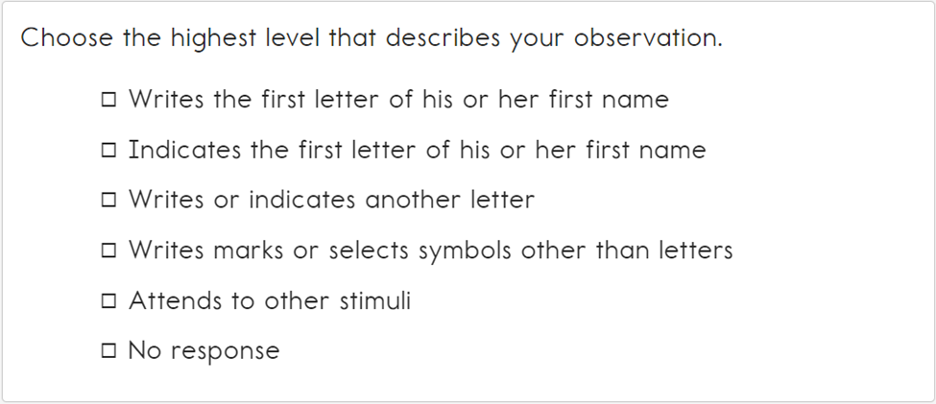
Items that assess student writing processes are evaluations of the test administrator’s observations of the student as the student completes items in the testlet. Figure 3.9 shows an example of a process item from an emergent writing testlet focused on letter identification in support of writing the student’s first name. The construct assessed in this item is the student’s ability to identify the first letter of his or her own name. In the example, either “writes the first letter of his or her own name” or “indicates the first letter of his or her own name” are scored as correct responses (Figure 3.9). The inclusion of multiple correct answer options is designed to ensure that this testlet is accessible to emergent writers who are beginning to write letters and emergent writers who have not yet developed writing production skills but are still able to identify the first letter of their name.
Figure 3.9: Example of an English Language Arts Emerging Writing Item Focused on Process
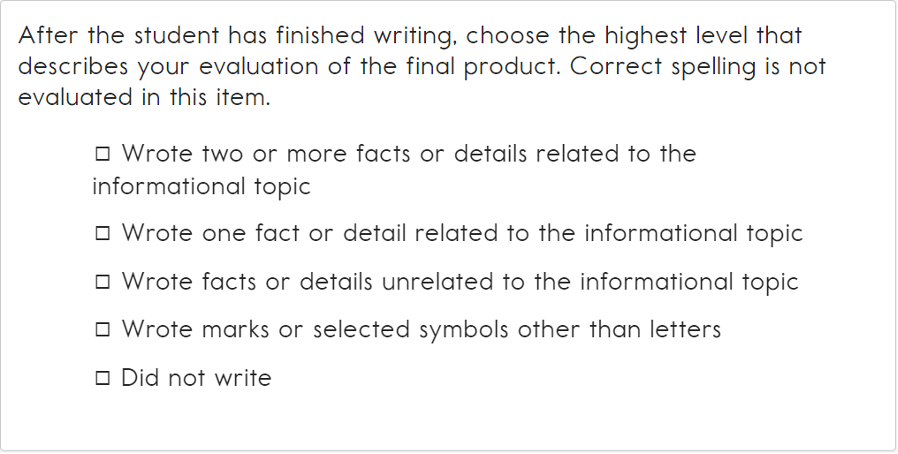
Items that assess writing products are the test administrator’s evaluations of the product created by the student as a result of the writing processes completed in the administration of the testlet. Figure 3.10 provides an example of an item that evaluates a student’s writing product. For some product items, administrators choose all the responses in the checklist that apply to the student’s writing product. The interrater reliability of the writing sample evaluations is described in Chapter 7 of this manual.
Figure 3.10: Example of an English Language Arts Conventional Writing Item Focused on Product
Writing testlets are constructed to provide test administrators with a coherent structure for delivering an instructionally relevant writing task to the student. Each writing testlet provides multiple opportunities for the test administrator to evaluate writing processes, and in some levels and grades, products. Each writing testlet measures multiple EEs. All EEs have five identified linkage level nodes, but writing testlets combine the delivery of assessments into emergent testlets and conventional testlets in Grades 3–8 and high school. The initial and distal precursor levels are combined into an emergent writing testlet. The proximal precursor, target, and successor levels are combined into a conventional writing testlet. Because writing testlets address multiple EEs and linkage levels, they differ from reading and mathematics testlets in that answer choices, rather than item stems, are aligned to nodes. Some items may include answer options associated to different EEs and linkage levels. For example, in Figure 3.9, the first two answer options are associated with a distal precursor linkage level node, while the third answer option is associated with an initial precursor linkage level node for the same EE.
3.2.3 Mathematics Testlets
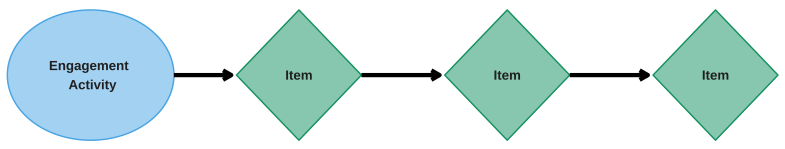
Mathematics testlets are designed to assess student knowledge and skills by focusing on cognitive processes and reducing extraneous cognitive load by using a common context across all items in the testlet. Figure 3.11 shows the order of presentation of mathematics testlets. The testlet begins with an engagement activity, which is followed by items that assess specific nodes associated with the EE and linkage level.
Figure 3.11: Elements of a Mathematics Testlet
Following the engagement activity, three to five items are presented to the student. Educator-administered testlets, delivered off-screen, require the student to interact with manipulatives and respond to specific questions asked by the educator. Items on computer-delivered testlets are delivered onscreen.
3.2.3.1 Engagement Activities
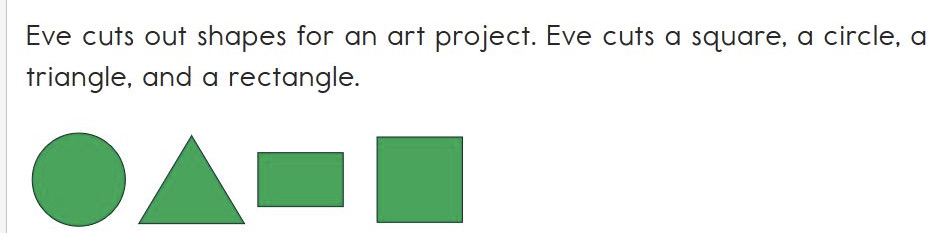
Mathematics testlets start with an engagement activity that provides context for the questions. The mathematics engagement activity in Figure 3.12 provides a context related to shapes and activates a cognitive process about putting things together. This example is written to be broadly applicable to students who might have personal experiences in art class or another context with putting shapes together. This activity is intended to prepare the student for items about combining shapes.
Figure 3.12: Example of a Mathematics Engagement Activity
3.2.3.2 Items
Computer-delivered mathematics testlets contain three item types: multiple choice, multiple-choice multiple-select, and matching. Technology-enhanced items such as multiple-select and matching are used when nodes at certain linkage levels would be difficult to assess using a multiple-choice item. One example is for students to sort objects based on shape. Educator-administered mathematics testlets use only multiple-choice items.
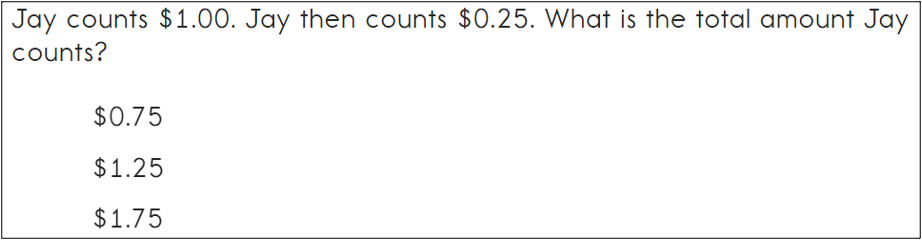
Multiple-choice items contain three answer options, one of which is correct. Students can select only one answer option. Most mathematics items use a multiple-choice item type. An example multiple-choice mathematics item using text as answer options is shown in Figure 3.13.
Figure 3.13: Example of a Mathematics Multiple-Choice Item with Text
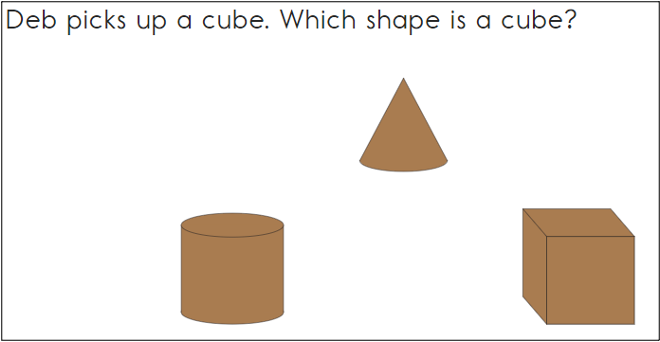
An example multiple-choice mathematics item using pictures as response options is shown in Figure 3.14.
Figure 3.14: Example of a Mathematics Multiple-Choice Item with Pictures
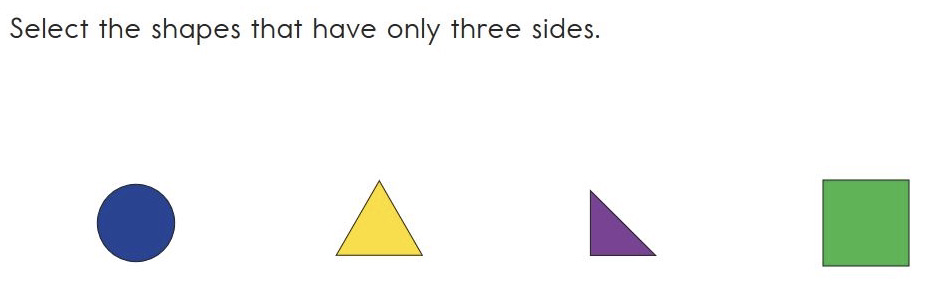
Multiple-choice multiple-select items provide the student with the opportunity to make more than one answer choice. An example of a multiple-choice multiple-select item is shown in Figure 3.15.
Figure 3.15: Example of a Mathematics Multiple-Choice Multiple-Select Item
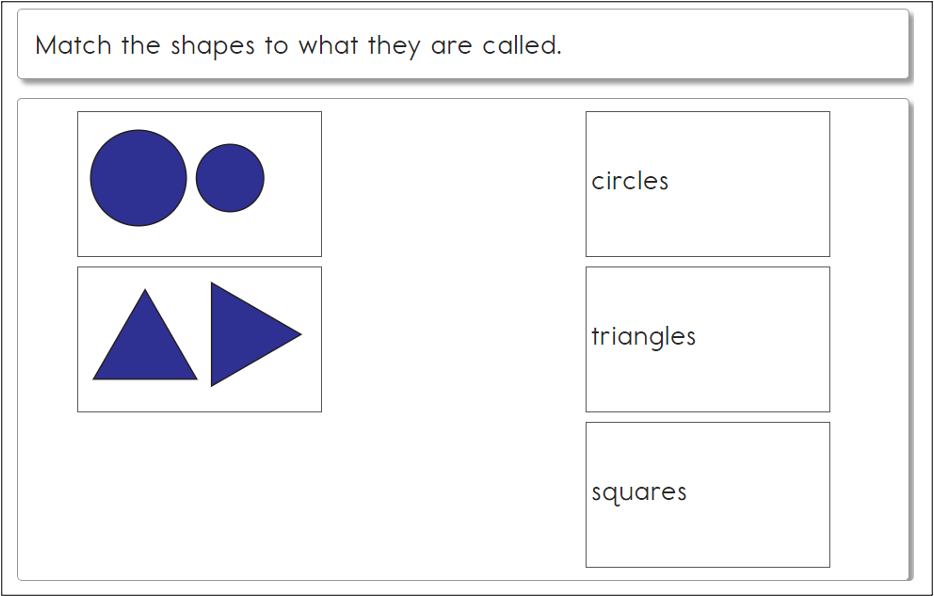
Some mathematics testlets use matching items where students match items from two lists. An example of a matching-lines item is shown in Figure 3.16. In this item type, the student selects a box from the left and then a box from the right. When the option from the right is selected, a line is drawn between the two selected boxes.
Figure 3.16: Example of a Mathematics Matching Item
3.2.4 Alternate Testlets for Students who are Blind or Have Visual Impairments
Two types of alternate testlets were developed for students who are blind or have visual impairments (BVI). Both were designed as alternates to the general testlet form for that EE and linkage level.
The first type was alternate testlets, called BVI forms, which are created when nodes are difficult to assess online for students who have visual impairments, even with features such as read aloud or magnification (such as locating a point on an onscreen coordinate plane). Computer-delivered BVI testlets begin with an instruction screen for the test administrator, then continue with content intended for the student to access. These testlets list materials that the educator may use to represent the onscreen content for the student. Objects are used instead of tactile graphics, which are too abstract for the majority of students with the most significant cognitive disabilities who are also blind. However, educators have the option to use tactile graphics if their student can use them fluently. In educator-administered BVI testlets, test administrators are recommended to use special materials for students who are blind or have visual impairments, but other familiar materials may be substituted. Details about needed materials for testlets delivered in both modes (computer- and educator-delivered) are provided in the Testlet Information Pages (see Chapter 4 of this manual). In 2021, mathematics BVI forms were retired and instead BVI pages were integrated into the Testlet Information Pages. In this case, students receive a standard mathematics form, and the Testlet Information Pages provide information on how to make appropriate adaptations for the student. This makes all general forms accessible to students who are blind or have visual impairments and increased the number of testlets available to those students. In 2022, there were a total of 47 BVI forms available for ELA EE and linkage level combinations, and BVI forms were selected for 195 students (1%).
The second type was Braille forms, which are available for grades 3–5 at the Target and Successor levels and in grades 6 through high school at the Proximal Precursor, Target, and Successor levels. Braille is intentionally limited to these grades and linkage levels as alternate forms. Braille forms are provided when sighted students are expected to read the equivalent content. At the lowest two linkage levels, and occasionally at the third linkage level in the lower grades, the assessed nodes are at levels where students are not yet reading, even on an emerging basis. For example, a student who is asked to differentiate between some and none, or to identify his or her own feelings, is not working on concrete representations of text for the purpose of reading. Because general versions of testlets at those EEs and levels do not require reading, braille is not provided at those levels. In total, Braille forms were made available for 543 EE/linkage level combinations (302 ELA, 241 mathematics), and Braille forms were selected for 10 students (<1%).
3.2.5 Practice Activities and Released Testlets
The DLM System provides educators and students with the opportunity to preview assessments by using practice activities and released testlets. Practice activities and released testlets are accessed through the online testing platform. Using login information provided by the system, both types of activities can be completed as many times as desired.
The practice activities are designed to familiarize users with testlet administration in the online testing platform. One practice activity is for educators, and the other practice activity is for students. The practice activity for educators provides information about the types of testlets that will be administered directly by the educator and is structured like an educator-administered testlet. The first screen introduces the concept of administering the educator-administered testlets. Next, the practice activity familiarizes educators with the navigation icons on the screen, as well as the spoken audio icon (available when students have this feature enabled in their Personal Needs and Preferences profile). The next screens cover the question format and required materials, followed by in-depth walkthrough of an ELA testlet. This walkthrough includes an example engagement activity, an example transition screen, and example sets of questions requiring specific educator-student interactions, requiring materials, using two screens, and using multiple choice with images. After the ELA testlet, there is an in-depth walkthrough of a mathematics testlet that includes mathematics questions that use two screens and mathematics questions requiring student demonstration. The final screen in the educator practice activity explores the answer summary page.
The student practice activity is formatted like a computer-delivered testlet. The first screen in the activity explains the navigation icons in the online testing platform. The second screen explains the two types of testlets that the student will encounter (ELA and mathematics). Next, the different types of questions (e.g., multiple choice, matching, sorting) are explained. Following each explanation, there is a practice question so that students can familiarize themselves with how to respond to each type of question. Two multiple choice questions are used, one that requires one answer selection and one that allows multiple answer selections. The final screens explain the answer summary page indicating if all the questions were answered and giving students a chance to navigate back to the testlet.
A released testlet is a publicly available sample DLM assessment. Released testlets cover the same content and are in the same format as operational DLM testlets. Students and educators can use released testlets as examples or opportunities for practice. Released testlets are developed using the same standards and methods used to develop testlets for the DLM operational assessments. New released testlets are added on a yearly basis. Released testlets are selected from a variety of EEs and linkage levels across Grades 3–12.
Each year, six testlets are selected for release from each subject based on several criteria. Criteria include providing testlets from across all grades/grade bands and linkage levels, that contain three to five items, measure EEs that are assessed in both administration models, and are useful for instruction.
In response to state inquiries about supplemental assessment resources to address the increase in remote or disrupted instruction due to COVID-19, DLM staff published additional ELA and mathematics released testlets during the spring 2020 window. Across all subjects, nearly 50 new released testlets were selected and made available through the online testing platform. To help parents and educators better review the available options for released testlets, DLM staff also provided tables for each subject that display the EEs and linkage levels for which released testlets are available.
The test development team selected new released testlets that would have the greatest impact for remote or disrupted instruction. The team prioritized testlets at the Initial Precursor, Distal Precursor, and Proximal Precursor linkage levels, as those linkage levels are used by the greatest number of students. The test development team selected testlets written to EEs that covered common instructional content, with a consideration for previously released testlets to minimize overlap between the testlets that were already available and new released testlets. The test development team also aimed to provide at least one new released testlet per grade level, where possible.
3.3 Test Development Procedures
This section covers test development principles and the test development process, including item writing, external reviews, and internal procedures for preparing test content for administration.
3.3.1 Test Development Principles
The DLM System uses a variant of ECD to develop processes for item and test development. ECD describes a conceptual framework for designing, developing, and administering educational assessments (Mislevy et al., 1999). The ECD framework supports the creation of well-constructed tests that are valid for their intended purposes by “explicating the relationships among the inferences the assessor wants to make about the student, what needs to be observed to provide evidence for those inferences, and what features of situations evoke that evidence” (Mislevy et al., 1999, p. 1). ECD requires test designers to define the relationships between inferences that they want to make about student skills and understandings and the tasks that can elicit evidence of those skills and understandings in the assessment. The ECD approach is structured as a sequence of test development layers that include (a) domain analysis, (b) domain modeling, (c) conceptual assessment framework development, (d) assessment implementation, and (e) assessment delivery (Mislevy & Riconscente, 2005). Since the original introduction of ECD, the principles, patterns, examples, common language, and knowledge representations for designing, implementing, and delivering educational assessment using the processes of ECD have been further elaborated for alternate assessment (DeBarger et al., 2011; Flowers et al., 2015).
The DLM System uses ECD procedures to develop test specifications and task templates for item creation that also incorporate UDL principles (Bechard et al., 2019). Incorporating principles of UDL allows students to respond to items free of barriers while emphasizing accessibility and offering multiple ways to demonstrate skills. The DLM task templates are called Essential Element Concept Maps (EECMs) and are described in section 3.3.3.1.3.
3.3.2 Overview of the Testlet Development Process
Items are developed by highly qualified item writers from across DLM states. After extensive training (see section 3.3.3.1.2 below), item writers draft testlets and receive peer feedback during item writing. The items undergo internal quality reviews and editorial reviews in several iterations before being reviewed externally by panels for content, bias and sensitivity, and accessibility for students with the most significant cognitive disabilities. After external reviews, testlets are prepared for field testing. Items are field tested by DLM students prior to being promoted to the operational pool of content. The full set of test development steps are outlined in Figure 3.17.
Figure 3.17: Steps in the Test Development Process
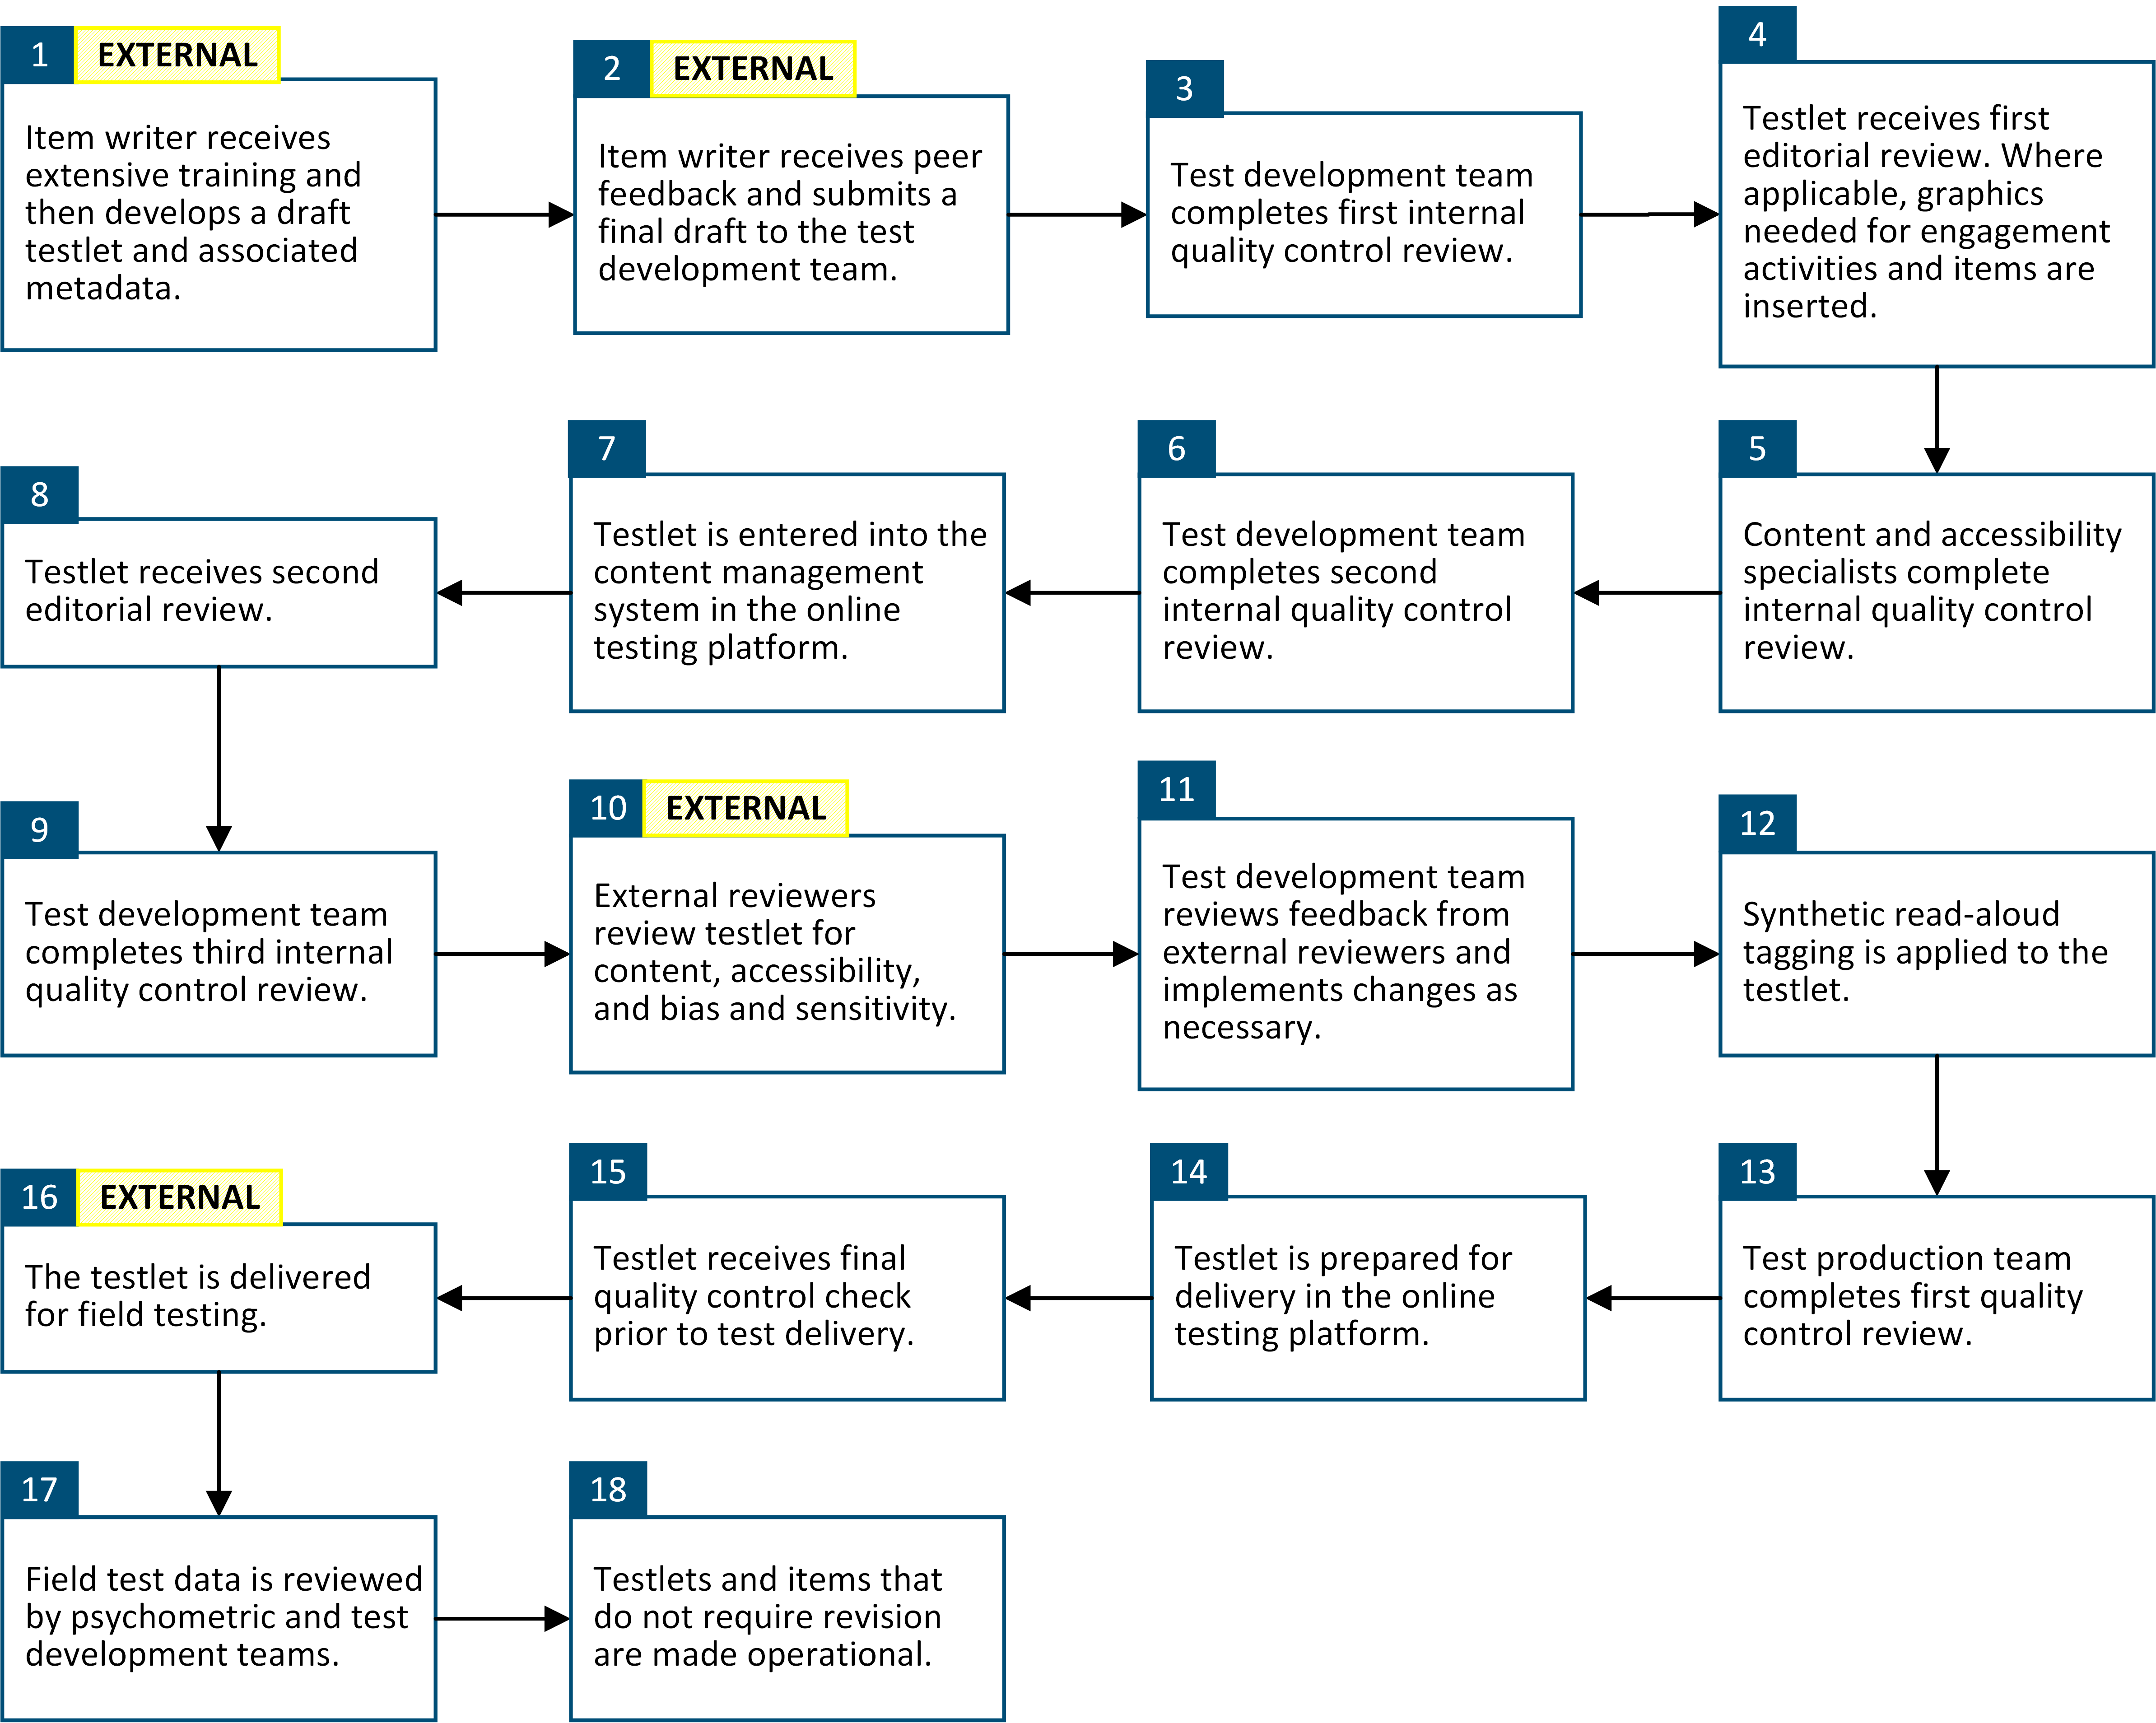
Each item writer is paired with another item writer who is assigned the same grade and subject. The item writer creates a first draft of the item. Item writers provide peer feedback to each other once first drafts are complete, and they take that feedback into account when completing their final draft. Item writers then submit final drafts to the test development team. The test development team conducts the first internal quality control review, which includes checks for alignment of the content to map nodes. Staff then conduct an editorial review and create any necessary images.
Staff internally review testlets for content, accessibility, language, and bias and sensitivity and address any feedback. The testlets are then externally reviewed by panels of educators for content, accessibility, and bias and sensitivity (see section 3.3.5). The test development team synthesizes and addresses this feedback. Items are prepared for field-test delivery, which includes adding synthetic read loud and preparing test delivery resources (see Chapter 4 of this manual for a description of Testlet Information Pages).
Test production, test development, and psychometric teams then complete a final quality control check for accessibility, display, content, and associated test delivery resources. Testlets are scheduled for field testing (see section 3.6.1). Following field-test data collection, staff review the field-test data to determine which testlets meet quality standards and are ready for operational assessment.
Security of materials is maintained throughout the test development process. Paper materials are kept in locked facilities. Electronic transfers are made on a secure network drive or within the secure content management system in the online testing platform.
3.3.3 Testlet and Item Writing
Highly qualified item writers are recruited annually from across DLM states to develop DLM items and testlets. Item writers are recruited based a multitude of characteristics, including teaching experience and experience with the DLM alternate assessment, with priority given to those with subject matter expertise, population expertise, and prior DLM item-writing experience. The number of item writers per year is determined based on the number of testlets needed, with a range of 4 to 117 participants per year from 2013–2022. Item writers are typically assigned one EE and linkage level to write for per round, with a range of 5 to 14 rounds across years.
3.3.3.1 2022 Testlet and Item Writing
Highly qualified, experienced item writers were selected to participate in a 2-day virtual item-writing event that was held on January 25–26, 2022. Item writer training included instruction on the item-writing process and peer review process. During the event, item-writing pairs collaborated and began to develop testlets. Following the virtual event, item writers continued producing and peer reviewing testlets virtually via a secure online platform through June 2022. A total of 427 testlets were produced, including 227 ELA testlets and 200 mathematics testlets.
3.3.3.1.1 Participants
Item writers were selected from the Accessible Teaching, Learning, and Assessment Systems (ATLAS) MemberClicks database. The database is a profile-based recruitment tool hosted in MemberClicks. The MemberClicks database includes individuals actively recruited via recommendations from governance board members and social media, individuals who have previously participated in an event, and individuals who created profiles via the “sign up to participate in DLM events” link on the DLM homepage. Interested individuals create and update their participant profile. Participant profiles include demographic, education, and work experience data.
A total of 245 individual profiles were pulled from the ATLAS MemberClicks Database for 2022 item writing. Minimum eligibility criteria included at least 1 year of teaching experience, teaching in a DLM state, and experience with the DLM alternate assessment. Prior DLM event participation, subject matter expertise, population expertise, and distribution of experience in each grade band was also considered in selection and assignment to a subject area. Of the 245 individuals, 77 individuals registered, completed advanced training, and committed to attend the event. In total, 69 item writers from 16 states attended both days of the training event and at least rounds 1 and 2 of the item-writing event. Of these item writers, 39 developed ELA testlets and 30 developed mathematics testlets.
The median and range of years of teaching experience is shown in Table 3.1. The median years of experience was at least 12 years for item writers of both ELA and mathematics testlets in pre-K–12.
| Teaching experience | Median | Range |
|---|---|---|
| Pre-K–12 | 15.0 | 2–37 |
| English language arts | 12.5 | 0–28 |
| Mathematics | 12.0 | 1–28 |
Grade 6 was most commonly taught by item writers (n = 34; 49%). See Table 3.2 for a summary.
| Grade level | n | % |
|---|---|---|
| Grade 3 | 29 | 42.0 |
| Grade 4 | 33 | 47.8 |
| Grade 5 | 32 | 46.4 |
| Grade 6 | 34 | 49.3 |
| Grade 7 | 32 | 46.4 |
| Grade 8 | 32 | 46.4 |
| High school | 25 | 36.2 |
The 69 item writers represented a highly qualified group of professionals representing both content and special education perspectives. The level and most common types of degrees held by item writers are shown in Table 3.3 and Table 3.4, respectively. The item writers with complete MemberClicks profiles held at least a bachelor’s degree. A majority (n = 59; 86%) also held a master’s degree, for which the most common field of study was special education (n = 28; 41%).
| Degree | n | % |
|---|---|---|
| Bachelor’s | 9 | 13.0 |
| Master’s | 59 | 85.5 |
| Not Specified | 1 | 1.4 |
| Degree | n | % |
|---|---|---|
| Bachelor’s degree | ||
| Education | 19 | 27.5 |
| Content specific | 1 | 1.4 |
| Special education | 14 | 20.3 |
| Other | 28 | 40.6 |
| Missing | 6 | 8.7 |
| Not specified | 1 | 1.4 |
| Master’s degree | ||
| Education | 17 | 28.8 |
| Content specific | 4 | 6.8 |
| Special education | 28 | 47.5 |
| Other | 9 | 15.3 |
| Missing | 1 | 1.7 |
Most item writers had experience working with students with disabilities (93%), and 97% had experience with the administration of alternate assessments. The variation in percentages suggest some item writers may have had experience with administration of alternate assessments but perhaps did not regularly work with students with disabilities.
Item writers reported a range of experience working with students with different disabilities, as summarized in Table 3.5. Item writers collectively had the most experience working with students with a significant cognitive disability, a mild cognitive disability, or multiple disabilities.
| Disability category | n | % |
|---|---|---|
| Blind/low vision | 31 | 44.9 |
| Deaf/hard of hearing | 32 | 46.4 |
| Emotional disability | 42 | 60.9 |
| Mild cognitive disability | 53 | 76.8 |
| Multiple disabilities | 54 | 78.3 |
| Orthopedic impairment | 30 | 43.5 |
| Other health impairment | 50 | 72.5 |
| Significant cognitive disability | 53 | 76.8 |
| Specific learning disability | 47 | 68.1 |
| Speech impairment | 42 | 60.9 |
| Traumatic brain injury | 30 | 43.5 |
The professional roles reported by the 2022 item writers are shown in Table 3.6. Roles included educators, instructional coaches, district staff, state education agency staff, and other (i.e., university staff, program coordinators, supervisors of instruction).
| Role | n | % |
|---|---|---|
| Classroom educator | 43 | 62.3 |
| Other | 17 | 24.6 |
| Instructional coach | 5 | 7.2 |
| District staff | 3 | 4.3 |
| State education agency staff | 1 | 1.4 |
Among the ELA and mathematics item writers, 16 DLM partner states were represented. ELA item writers were from 13 different states and the District of Columbia and mathematics item writers were from 13 different states. Population density of schools in which item writers taught or held a position is reported in Table 3.7. Rural was defined as a population living outside settlements of 1,000 or fewer inhabitants, suburban was defined as an outlying residential area of a city of 2,000–49,000 or more inhabitants, and urban was defined as a city of 50,000 inhabitants or more. The demographics for the item writers are presented in Table 3.8.
| Population density | n | % |
|---|---|---|
| Rural | 30 | 43.5 |
| Suburban | 21 | 30.4 |
| Urban | 18 | 26.1 |
| n | % | |
|---|---|---|
| Gender | ||
| Female | 65 | 94.2 |
| Male | 3 | 4.3 |
| Chose not to disclose | 1 | 1.4 |
| Race | ||
| White | 64 | 92.8 |
| African American | 3 | 4.3 |
| Chose not to disclose | 2 | 2.9 |
| Hispanic ethnicity | ||
| Non-Hispanic | 64 | 92.8 |
| Hispanic | 3 | 4.3 |
| Chose not to disclose | 2 | 2.9 |
3.3.3.1.2 Item Writer Training
Training for item writing consisted of independent asynchronous advance training via a secure online platform as well as synchronous training on the first day of the virtual event. The advance training modules consisted of an overview module focused on the DLM assessment system and population of students, subject-specific information related to ELA or mathematics, and information on UDL, accessibility considerations, and bias and sensitivity considerations. There was a brief posttest at the end of each module that item writers were required to pass with 80% accuracy (item writers were allowed to take the quiz as many times as necessary to reach the 80% requirement). The virtual event training consisted of targeted instruction regarding the structure and development of DLM ELA and mathematics testlets and items from an ECD perspective, including information on accessibility and bias and sensitivity considerations.
3.3.3.1.3 Essential Element Concept Maps
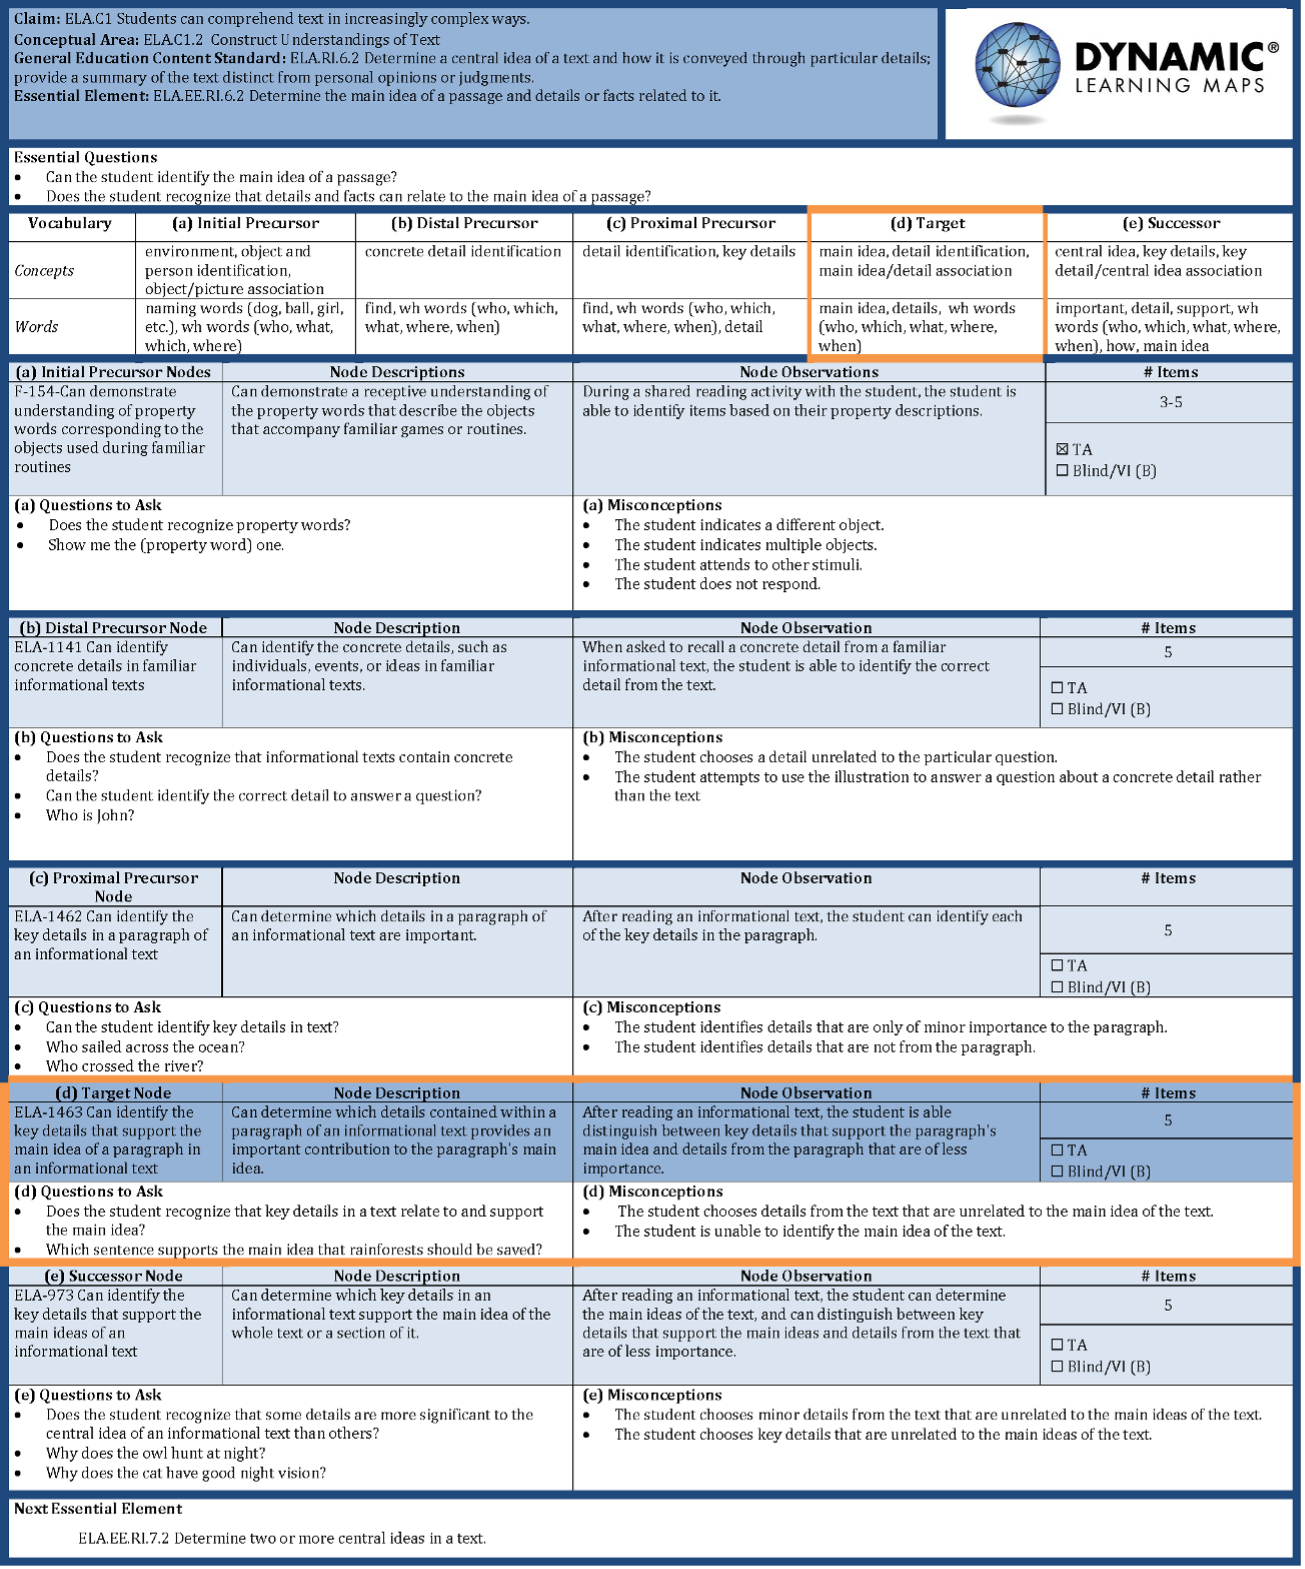
Item and testlet writing are based on EECMs. These graphic organizers are provided as guides to item writers. EECMs use principles of ECD and UDL to define ELA and mathematics content specifications for assessment development. For more information about ECD, see section 3.3.1 of this chapter.
ELA and mathematics test development teams developed the EECMs (Bechard & Sheinker, 2012). Staff with student population expertise also reviewed EECM contents. The templates were specifically designed for clarity and ease of use, as the project engages nonprofessional item writers from states administering DLM assessments who needed to create a large number of items in a constricted timeframe.
The EECMs provide item writers with a content-driven guide on how to develop content-aligned and accessible items and testlets for the DLM student population. Each EECM defines the content framework of a target EE with five levels of complexity (i.e., linkage levels) and identifies key concepts and vocabulary at each level. Developers selected nodes from the learning maps to be assessed at different linkage levels based on an analysis of the map structure. The EECM also describes and defines common misconceptions, common questions to ask, and prerequisite and requisite skills. Finally, the EECM identifies accessibility issues related to particular concepts and tasks.
The EECM has seven functions:
- Identify the targeted standard by claim, conceptual area, Common Core State Standards, and EE;
- Identify key vocabulary to use in testlet questions;
- Describe and define a range of skill development (five levels);
- Describe and define misconceptions;
- Identify requisite and prerequisite skills;
- Identify questions to ask; and
- Identify content through the use of accessibility flags that may require an alternate approach to assessment for some students.
An example EECM that was used for item development is shown in Figure 3.18.
Figure 3.18: Example Essential Element Concept Map Graphic Organizer for ELA.EE.RI.6.2
In addition to text descriptions, EECMs include a small view of the nodes associated with the EE. These mini-maps were provided as a visual means of formally identifying the relationships between skills so that item writers would be able to consider them during the design of testlets. Figure 3.19 shows an example of a mini-map used during test development.
Figure 3.19: Example Mini-Map for ELA.EE.RI.6.2—Determine the main idea of a passage and details or facts related to it
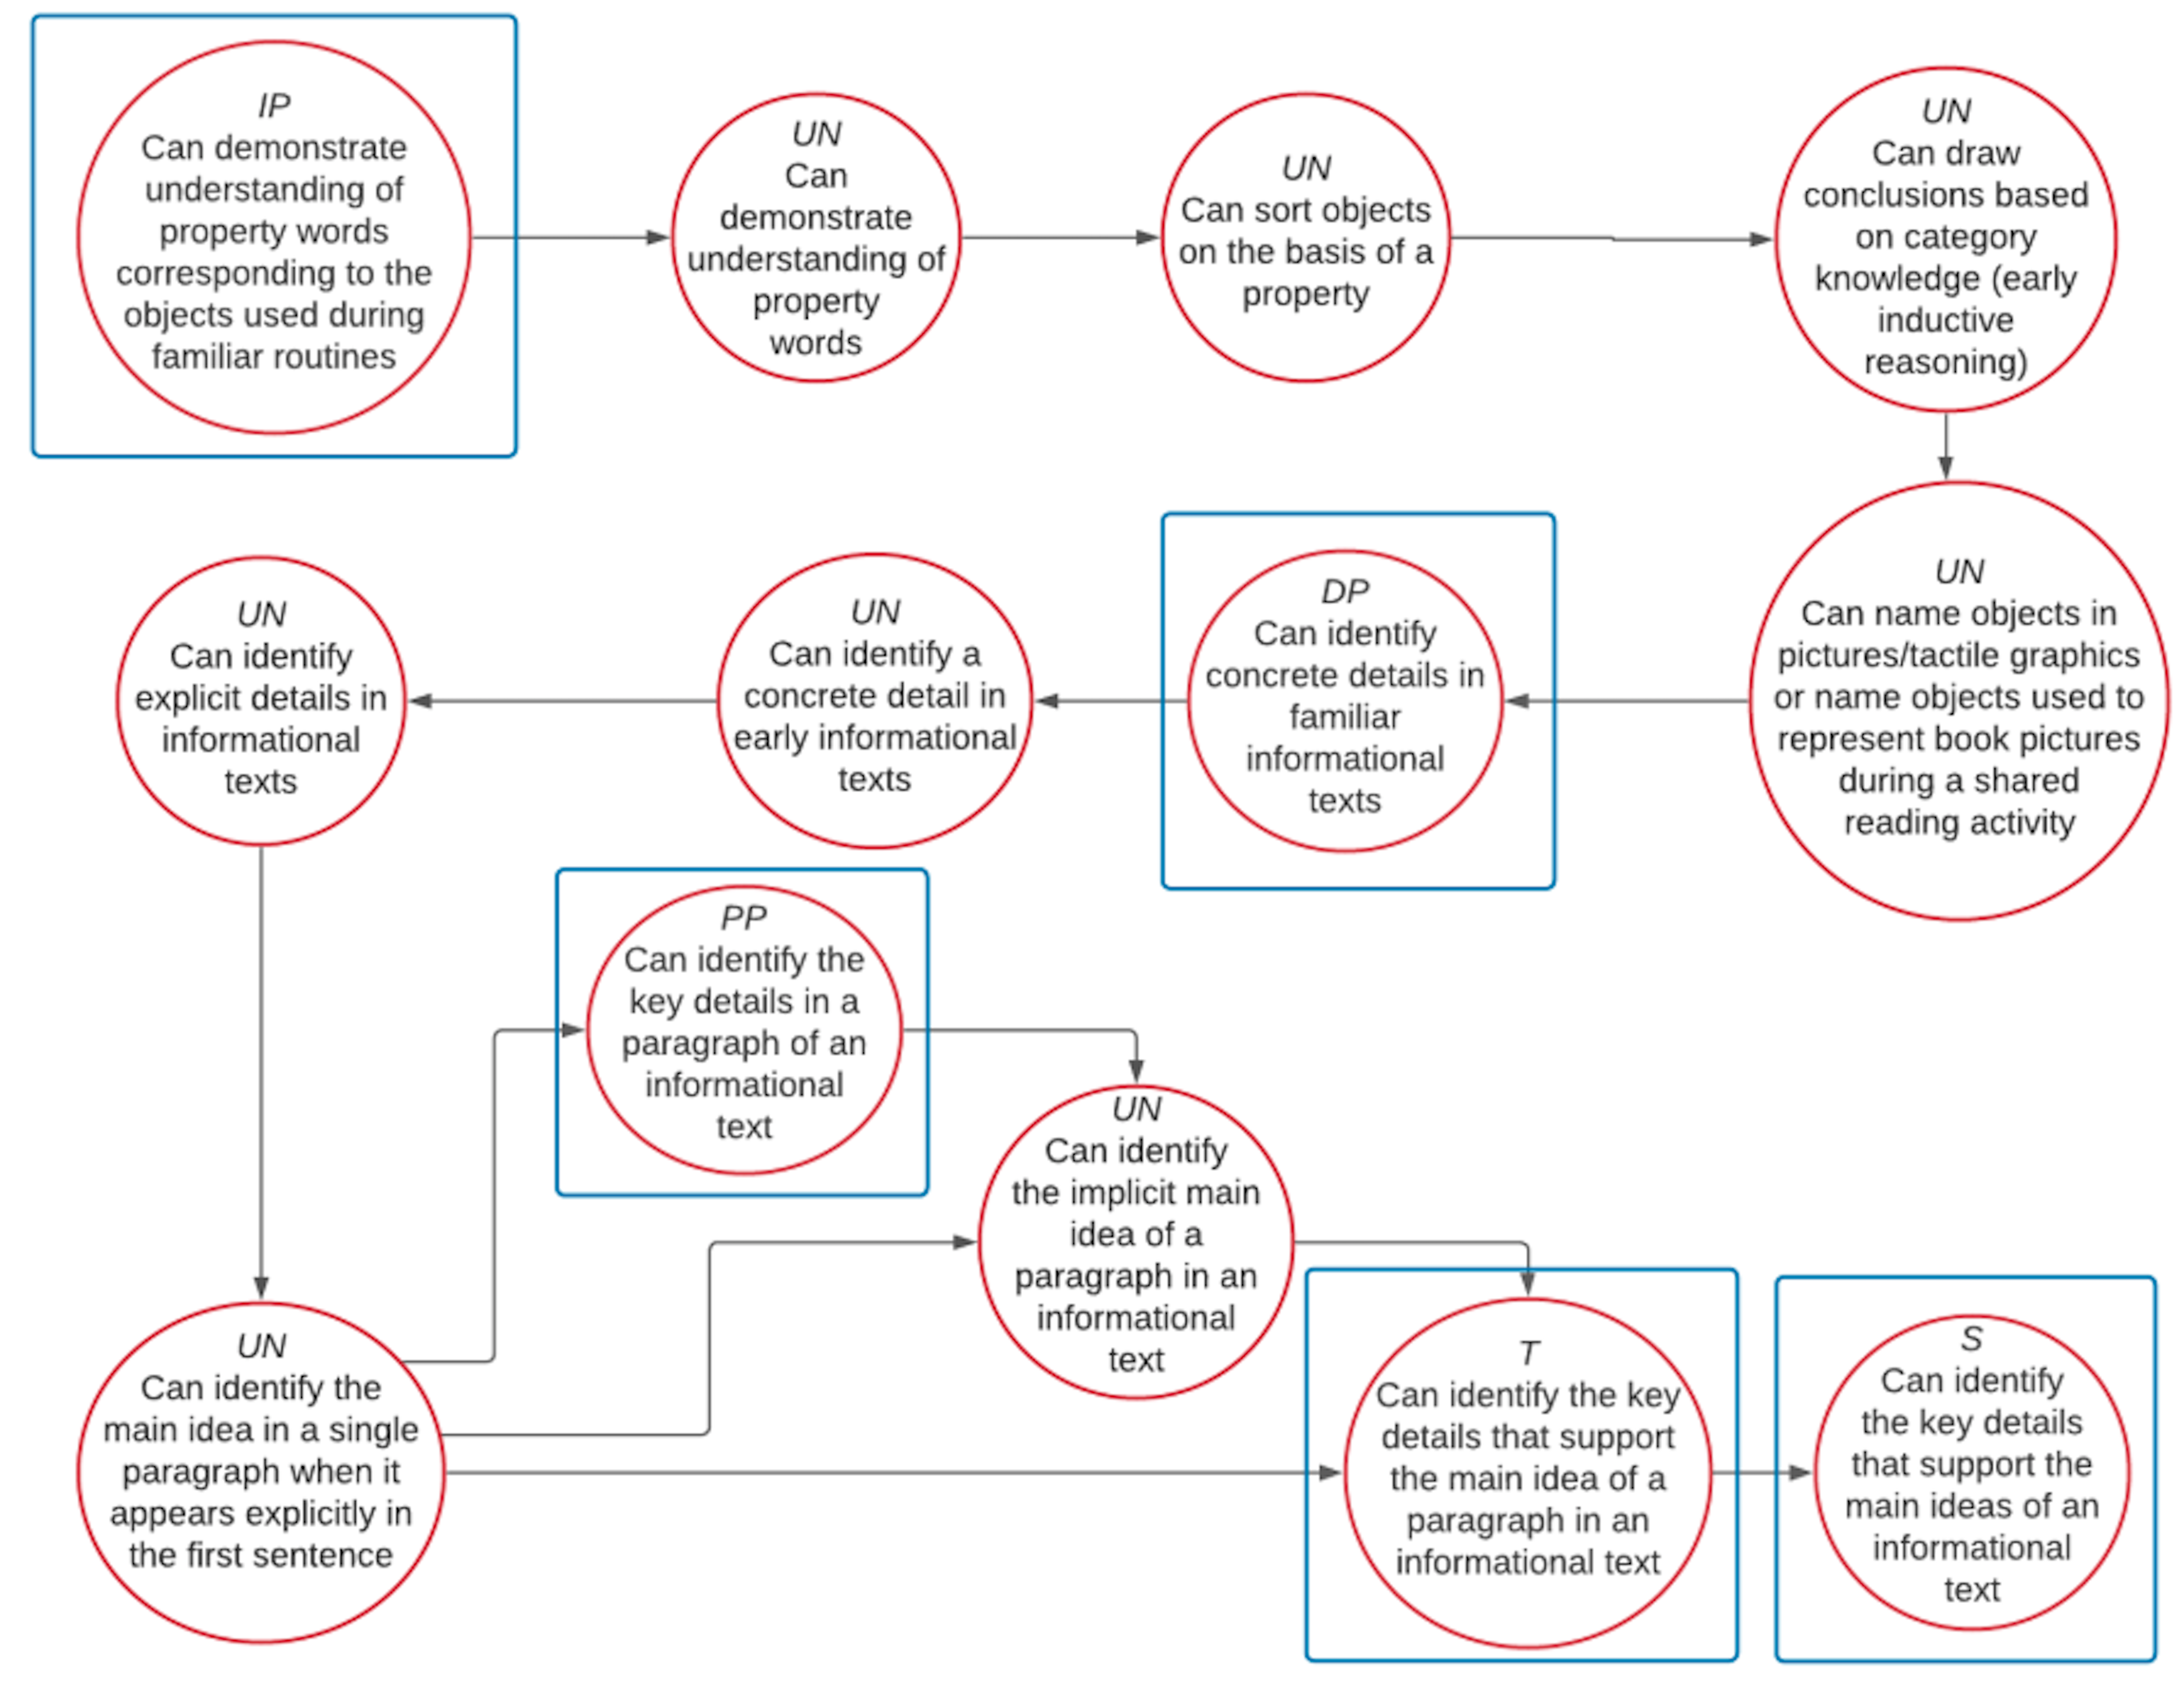
IP = Initial Precursor; DP = Distal Precursor; PP = Proximal Precursor; T = Target; S = Successor; UN = Untested. Boxes indicate tested nodes.
3.3.3.1.4 Other Item-Writing Resource Materials
In addition to the EECMs, item writers used material developed by test development teams to support the creation of testlets. All item writers used the DLM Core Vocabulary List. Core vocabulary is made up of words used most commonly in expressive communication (Yorkston et al., 1988). DLM Core Vocabulary is a comprehensive list of words that reflects the research in core vocabulary in Augmentative and Alternative Communication and words needed to successfully communicate in academic settings when the EEs are being taught (Dennis et al., 2013). Additionally, all item writers used an item-writing manual containing general information about DLM testlets and items, instructions for populating testlet templates, and subject-specific information related to such topics as the order of testlet elements and item types unique to each subject (e.g., select text for ELA or matching lines for mathematics). Item writers were also provided with examples of completed testlet templates in both subjects and instructions on testlet development for students who are blind or have visual impairments. The ELA test development team also shared guides to writing texts.
3.3.3.1.5 Item-Writing Process
Because DLM assessments consist of short, coherent, instructionally relevant testlets, item writers produced entire testlets rather than stand-alone items. Item writers reviewed the vocabulary (concepts and words) on the EECM appropriate for each testlet level. Item writers assumed that students were expected to understand, but not necessarily use, these terms and concepts. Item writers were also responsible for writing testlets at increasing levels of complexity, from less complex to more complex linkage levels, when they were writing across linkage levels. Using the EECMs, item writers selected specific vocabulary for the testlet that matched the cognitive complexity of the node(s) being assessed at that linkage level.
Item writers used the EECM “questions to ask” and “misconceptions” information when writing testlets. The questions describe what evidence is needed to show that the student can move from one level to the next, more complex level, and the possible misconceptions or errors in thinking that could be a barrier to students demonstrating their understanding. These EECM sections assisted the item writers to create stems (i.e., the item prompts) and answer options for items in testlets.
Item writers were instructed to write testlet content to be accessible for all students who might receive each testlet. The goal for the item writer was to create testlets that were accessible to the greatest number of students possible. Item writers were also directed to consider barriers that may be present due to the sensitive nature of the content or bias that may occur, which could advantage or disadvantage a particular subgroup group of students.
During item development, item writers and DLM staff maintained the security of materials. Item writers signed security agreements.
3.3.3.1.6 Item Writer Evaluations
An evaluation survey of the item-writing experience was sent to all participating item writers after the item-writing event. Item writers were asked to provide feedback on the perceived effectiveness of training and the overall experience of the item-writing event, as well as narrative comments on their experience and suggestions for future DLM item-writing events.
The majority of item writers responded to the post-event survey (n = 33 for ELA, n = 23 for mathematics). Table 3.9 and Table 3.10 detail responses to the perceived effectiveness questions from the survey for ELA and mathematics item writers, respectively.
|
Very effective
|
Somewhat effective
|
Not at all effective
|
||||
|---|---|---|---|---|---|---|
| Degree | n | % | n | % | n | % |
| Advanced training | 26 | 78.8 | 7 | 21.2 | 0 | 0.0 |
| Virtual training | 26 | 78.8 | 7 | 21.2 | 0 | 0.0 |
| Practice activities | 26 | 78.8 | 6 | 18.2 | 1 | 3.0 |
| Online resources | 31 | 93.9 | 1 | 3.0 | 1 | 3.0 |
| Discussion with other item writers | 26 | 78.8 | 7 | 21.2 | 0 | 0.0 |
| Feedback from DLM staff | 28 | 84.8 | 5 | 15.2 | 0 | 0.0 |
|
Very effective
|
Somewhat effective
|
Not at all effective
|
||||
|---|---|---|---|---|---|---|
| Degree | n | % | n | % | n | % |
| Advanced training | 17 | 73.9 | 6 | 26.1 | 0 | 0.0 |
| Virtual training | 15 | 65.2 | 8 | 34.8 | 0 | 0.0 |
| Practice activities | 17 | 73.9 | 6 | 26.1 | 0 | 0.0 |
| Online resources | 22 | 95.7 | 1 | 4.3 | 0 | 0.0 |
| Discussion with other item writers | 20 | 87.0 | 2 | 8.7 | 1 | 4.3 |
| Feedback from DLM staff | 23 | 100.0 | 0 | 0.0 | 0 | 0.0 |
Overall, item writers rated the training they received, the practice activities, the online resources, the feedback from the DLM staff, and the discussion with other item writers as very effective. They expressed appreciation of the knowledge gained through the item-writing event and the opportunities to collaborate with peers.
3.3.4 ELA Text Development
This section describes the development of ELA texts. After these texts undergo text-specific external review (see section 3.3.5.2), they are incorporated into testlets that are externally reviewed through the standard testlet review process.
3.3.4.1 Original Development of Texts
The test development team originally created ELA texts by adapting from or relating to grade-level–appropriate general education texts. The team constructed short narrative texts from books commonly taught in general education and wrote short informational texts to relate to thematic elements from narratives. The team deliberately wrote all texts to provide an opportunity to assess specific nodes in the maps associated with different EEs and linkage levels. They reduced text complexity in the ELA texts from the grade-level texts for students without significant cognitive disabilities. The team also developed texts using clear language that reduced any need for prior knowledge. They favored simple sentences, reduced the use of pronouns, and favored consistency in sentence structure within a text. DLM texts are short and consist of 50–250 words, including high-frequency, easily decodable words, such as those found on the DLM Core Vocabulary List.
3.3.4.2 Recent Development of Texts
New ELA texts were most recently developed in 2019–2020. Throughout 2019–2020, the ELA test development team created new reading literature and reading informational texts. To determine the number and types of new texts needed, EEs and linkage levels were identified in which two or fewer texts were available, and/or available texts could not support five items per testlet. Following the identification of needed ELA texts, the specifications for each new text to be developed—including nodes, text type (reading literature or reading informational text), and the exemplar source book—were identified.
ELA test development staff wrote, selected images for, and peer reviewed each text. Thirty new texts were written. The number and types of texts created for each grade are summarized in Table 3.11. Just over half of the new ELA texts (n = 16; 53%) were reading informational texts. There were 14 (47%) new reading literature texts written.
| Grade/Grade band | Reading literature | Reading informational | Total |
|---|---|---|---|
| 3 | 2 | 2 | 4 |
| 4 | 2 | 2 | 4 |
| 5 | 2 | 2 | 4 |
| 6 | 2 | 2 | 4 |
| 7 | 2 | 2 | 4 |
| 8 | 2 | 2 | 4 |
| 9–10 | 0 | 2 | 2 |
| 11–12 | 2 | 2 | 4 |
| Total | 14 | 16 | 30 |
Following review by test development staff, the texts and images were reviewed by Special Education experts and senior DLM staff to evaluate whether each ELA text met DLM guidelines and supported the assigned EEs, linkage levels, and nodes. The ELA texts received an editorial review before being finalized for external review.
3.3.5 External Reviews
3.3.5.1 Items and Testlets
The purpose of external reviews of items and testlets is to evaluate whether items and testlets measure the intended content, are accessible, and are free of bias or sensitive content. Panelists use external review criteria established for DLM alternate assessments to rate items and testlets as “accept”, “revise”, or “reject” and provide recommendations for “revise” ratings or an explanation for “reject” ratings. The test development team uses collective feedback from the panelists to inform decisions about items and testlets before they are field-tested.
The external review process was piloted in a face-to-face meeting in Kansas City, Missouri, in August 2013 before being implemented in the secure, online content management system in the testing platform. Educators nominated by DLM Governance Board members, including several governance board members themselves, participated as panelists. The pilot event was used to evaluate the effectiveness of reviewer training, clarity and appropriateness of the review criteria for each panel type, and the options available for rating and providing feedback on items and testlets.
Subsequent external review events have followed the structure established in the initial pilot and minimally revised over the operational years of the program. Panelists receive training regarding the review criteria and structure of the DLM assessment, and they continue to complete reviews using the online content management system in the testing platform.
3.3.5.1.1 Overview of Review Process
External review for 2021 was held as a 2-day virtual event. The virtual advance training, training for the panel meetings, and facilitator and co-facilitator training were updated to meet the needs of virtual panel meetings. Previously, one facilitator led the feedback discussion for each panel, whereas for the virtual event, a facilitator and co-facilitator led the feedback discussions and recorded decisions for each panel meeting.
External reviews were conducted by members of three distinct review panels: content, accessibility, and bias and sensitivity. Reviewers were assigned to one type of review panel based on their expertise and used the criteria for that panel to conduct reviews. For each item and each testlet, reviewers made one of three decisions: “accept”, “revise”, or “reject.” Reviewers made decisions independently and without discussion with other reviewers before joining with the facilitator and co-facilitator for a consensus discussion and decision. Both independent and consensus reviews were completed using an application in the secure content management system in the online testing platform. Resulting ratings were compiled and submitted to DLM staff, and DLM staff made final decisions regarding whether the testlet should be rejected, accepted as is, or revised before field testing.
3.3.5.1.2 Review Assignments and Training
Panelists were selected from the ATLAS MemberClicks database and were assigned to content, accessibility, or bias and sensitivity panels based on their qualifications.
In 2021, there were 47 panelists. Of those, 16 were content-specific panelists; 8 were ELA panelists and 8 were mathematics panelists. There were also 16 accessibility panelists and 15 bias and sensitivity panelists who reviewed items and testlets from each subject.
Prior to participating in the virtual panel meetings, panelists completed an advance training course that included an External Review Procedures module and a module that specifically aligned to their assigned panel type. The content modules were subject-specific, while the accessibility and bias and sensitivity modules were universal for all subjects. The content modules described the review criteria for items and testlets and included examples to illustrate the concepts. The accessibility module covered accessibility criteria, including examples for items and testlets. The item accessibility criteria specifically focused on accessibility of text and graphics. The testlet accessibility criteria specifically focused on instructional relevance and ensuring that the testlet is barrier-free. The bias and sensitivity module covered item bias and testlet sensitivity criteria. The item bias criteria included items having a fair construct, a representation of diversity, using people-positive language, avoiding language bias, and avoiding content likely to cause an extreme emotional response. The testlet sensitivity criteria included testlets avoiding sensitive content and language bias. Examples were provided to illustrate the concepts covered in the bias and sensitivity module. After each module, panelists completed a posttest and were required to score 80% or higher to pass advance training; panelists could attempt the posttest as many times as necessary to reach a score of 80%. At the beginning of the virtual event, facilitators reviewed the procedures for how panelists would complete their ratings. Then facilitators reviewed panel-specific information, based on the panel type. This included a security and confidentiality reminder, background information, and an overview of the panel-specific criteria.
During the virtual event, panelists first completed asynchronous reviews of a small calibration set of testlets, followed by a synchronous review of the calibration set focused on items and testlets flagged during the asynchronous review. Subsequent collections of testlets were larger but adhered to this same process of asynchronous reviews followed by synchronous reviews of items and testlets flagged during the asynchronous review. Each panel had two virtual panel meetings led by facilitators and co-facilitators to obtain collective feedback about the items and testlets. Content panels had fewer testlets per collection because these panels reviewed only subject-specific testlets, whereas the bias and sensitivity and accessibility panels had more testlets per collection because these panelists reviewed testlets from all subjects.
The median and range of years of teaching experience is shown in Table 3.12. The median years of experience for external reviewers was 15 years in pre-K–12, 13 years in ELA, and 11 years in mathematics.
| Teaching experience | Median | Range |
|---|---|---|
| Pre-K–12 | 15.0 | 5–38 |
| English language arts | 13.0 | 2–38 |
| Mathematics | 11.0 | 1–35 |
High school was the most commonly taught grade level by the external reviewers (n = 42; 33%). See Table 3.13 for a summary.
| Grade level | n | % |
|---|---|---|
| Grade 3 | 10 | 21.3 |
| Grade 4 | 9 | 19.1 |
| Grade 5 | 12 | 25.5 |
| Grade 6 | 16 | 34.0 |
| Grade 7 | 20 | 42.6 |
| Grade 8 | 20 | 42.6 |
| High school | 42 | 89.4 |
The 47 external reviewers represented a highly qualified group of professionals. The level and most common types of degrees held by external reviewers are shown in Table 3.14 and Table 3.15, respectively. A majority (n = 42; 89%) also held a master’s degree, for which the most common field of study was special education (n = 13; 28%).
| Degree | n | % |
|---|---|---|
| Bachelor’s | 5 | 10.6 |
| Master’s | 42 | 89.4 |
| Degree | n | % |
|---|---|---|
| Bachelor’s degree | ||
| Education | 13 | 27.7 |
| Special education | 11 | 23.4 |
| Other | 20 | 42.6 |
| Missing | 3 | 6.4 |
| Master’s degree | ||
| Education | 10 | 23.8 |
| Content specific | 3 | 7.1 |
| Special education | 13 | 31.0 |
| Other | 16 | 38.1 |
Most external reviewers had experience working with students with disabilities (74%), and 74% had experience with the administration of alternate assessments.
External reviewers reported a range of experience working with students with different disabilities, as summarized in Table 3.16. External reviewers collectively had the most experience working with students with a significant cognitive disability, specific learning disability, other health impairments, or multiple disabilities.
| Disability category | n | % |
|---|---|---|
| Blind/low vision | 13 | 27.7 |
| Deaf/hard of hearing | 10 | 21.3 |
| Emotional disability | 24 | 51.1 |
| Mild cognitive disability | 24 | 51.1 |
| Multiple disabilities | 30 | 63.8 |
| Orthopedic impairment | 15 | 31.9 |
| Other health impairment | 27 | 57.4 |
| Significant cognitive disability | 27 | 57.4 |
| Specific learning disability | 29 | 61.7 |
| Speech impairment | 25 | 53.2 |
| Traumatic brain injury | 16 | 34.0 |
Panelists had varying experience teaching students with the most significant cognitive disabilities. ELA panelists had a median of nine years of experience teaching students with the most significant cognitive disabilities, with a minimum of four years and a maximum of nine years of experience. Mathematics panelists had a median of nine years of experience teaching students with the most significant cognitive disabilities, with a minimum of four years and a maximum of nine years of experience.
The professional roles reported by the 2021 reviewers are shown in Table 3.17. Panelists who reported “other” roles included administrators, program directors, assessment coordinators, and individuals identifying with multiple categories.
| Role | n | % |
|---|---|---|
| Classroom educator | 36 | 76.6 |
| Instructional coach | 2 | 4.3 |
| Other | 6 | 12.8 |
| State education agency staff | 2 | 4.3 |
| Not specified | 1 | 2.1 |
Among the ELA and mathematics panelists, nine DLM partner states were represented. ELA panelists were from seven different states and the District of Columbia and mathematics panelists were from three different states. Population density of schools in which panelists taught or held a position is reported in Table 3.18. Rural was defined as a population living outside settlements of 1,000 or fewer inhabitants, suburban was defined as an outlying residential area of a city of 2,000–49,000 or more inhabitants, and urban was defined as a city of 50,000 inhabitants or more. The demographics for the external reviewers are presented in Table 3.19.
| Population density | n | % |
|---|---|---|
| Rural | 19 | 40.4 |
| Suburban | 12 | 25.5 |
| Urban | 16 | 34.0 |
| n | % | |
|---|---|---|
| Gender | ||
| Female | 36 | 76.6 |
| Male | 11 | 23.4 |
| Race | ||
| White | 36 | 76.6 |
| African American | 5 | 10.6 |
| Asian | 2 | 4.3 |
| American Indian | 1 | 2.1 |
| Native Hawaiian or Pacific Islander | 1 | 2.1 |
| Chose not to disclose | 2 | 4.3 |
| Hispanic ethnicity | ||
| Non-Hispanic | 44 | 93.6 |
| Hispanic | 2 | 4.3 |
| Chose not to disclose | 1 | 2.1 |
3.3.5.1.3 Review Responsibilities
The primary responsibility for reviewers was to review items and testlets using established standards and guidelines. These standards and guidelines are found in the Guide to External Review of Testlets (Dynamic Learning Maps Consortium, 2014). Reviewers completed a security agreement before reviewing and were responsible for maintaining the security of materials at all times.
3.3.5.1.4 Decisions and Criteria
External reviewers looked at testlets and made decisions about both the items in the testlet, and the testlet overall. An overview of the decision-making process is described below.
General Review Decisions. For DLM assessments, “acceptability” at the external review phase was defined as meeting minimum standards to be ready for field testing. Reviewers made one of three general decisions: “accept”, “revise”, or “reject.” The definition of each decision is summarized in Table 3.20.
| Decision | Definition |
|---|---|
| Accept | Item or testlet is within acceptable limits. It may not be perfect, but it can be field tested. |
| Critical revision required (revise) | Item or testlet violates one or more criteria. It has some potential merits and can be acceptable for field testing after revisions to address the criteria. |
| Reject | Item or testlet is fatally flawed. No revision could bring this item/testlet to within acceptable limits. |
Judgments about items were made separately from judgments about testlets because different criteria are used for items and testlets. Therefore, it is possible to recommend revisions or rejections to items without automatically having to recommend revision or rejection to the testlet as a whole. If reviewers recommended revision or rejection, they were required to provide an explanation that included identification of the problem and, in the case of revision, a proposed solution.
Review Criteria. In all external reviews, the criteria for each type of panel (i.e., content, accessibility, bias and sensitivity) were different. All three panel types had criteria to consider for items and other criteria for testlets as a whole. Training on the criteria was provided in the online training modules and in the on-site training. There were specific criteria for external reviewers of content, accessibility, and bias and sensitivity.
The content, accessibility, and bias and sensitivity review criteria are presented in Table 3.21, Table 3.22, and Table 3.23, respectively.
| Criteria |
|---|
| Item |
|
|
|
|
|
| Testlet |
|
|
| Criteria |
|---|
| Item |
|
|
| Testlet |
|
|
| Criteria |
|---|
| Item |
|
|
|
|
|
| Testlet |
|
|
3.3.5.1.5 Results of Reviews
For ELA, the percentage of items rated as accept across grades, panels, and rounds of review ranged from 70% to 99%. The percentage of testlets rated as accept across grades, panels, and rounds of review ranged from 66% to 96%. The percentage of items and testlets rated as revise ranged from 1% to 29% and 3% to 33%, respectively. The rate at which items and testlets were recommended for rejection ranged from 0% to <1% and 0%, respectively.
For mathematics, the percentage of items and testlets rated as accept ranged from 60% to 99% and 68% to 100%, respectively across grades, panels, and rounds of review. The percentage of items and testlets rated as revise ranged from 1% to 39% and 0% to 30%, respectively. The rate at which both items and testlets were recommended for rejection ranged from 0% to 1%.
3.3.5.1.6 Test Development Team Decisions
Because each item and testlet is examined by three distinct panels, ratings were compiled across panel types, following a process last updated in 2017–2018. The test development team reviewed the collective feedback provided by the panelists for each item and testlet. There are five decision options for the test development team to apply to each item and testlet: (a) accept, no pattern of similar concerns, accept as is; (b) revise minor, pattern of minor concerns, will be addressed; (c) revise major, major revision needed; (d) reject; and (e) more information needed. Once the test development team viewed each item and testlet and considered the feedback provided by the panelists, they assigned a decision. While panelist recommendations are carefully considered, the test development team does not make decisions solely on those recommendations.
The ELA test development team accepted as is 91% of items. Of the items that were revised, most required major changes (e.g., stem or response option replaced) as opposed to minor changes (e.g., minor rewording but concept remained unchanged). The ELA test development team made two (3%) minor revisions and 75 (97%) major revisions to items, and they rejected zero testlets.
The mathematics test development team accepted as is 47% of items. Of the items and testlets that were revised, most required major changes (e.g., stem or response option replaced) as opposed to minor changes (e.g., minor rewording but concept remained unchanged). The mathematics test development team made 72 (17%) minor revisions and 351 (83%) major revisions to items, and they rejected two testlets.
3.3.5.2 External Review of ELA Texts
The purpose of the external review of texts is to evaluate whether they are measuring the intended content, are accessible, are free of biased or sensitive content, and include appropriate imagery. Panelists also provide recommendations for revisions or an explanation for a “reject” rating. The ELA test development team uses the collective feedback from the panelists to inform decisions about texts and images before they are used in item and testlet development.
Following their finalization, an external review of texts for 2020 was conducted as a 2-day virtual event with panel meetings. There were four panels of between 3 and 6 individuals per panel. The facilitator and co-facilitator trainings were updated to meet the needs of virtual panel meetings, and the panelist advance training was revised to be more comprehensive. Panelists completed one advance training module designed to provide background information on the DLM alternate assessment and DLM ELA testlets and texts and received more rigorous training from DLM staff at the beginning of the event. Panelists completed independent reviews before a facilitator and co-facilitator led the feedback discussions and recorded decisions for each panel meeting.
3.3.5.2.1 Recruitment, Training, Panel Meetings, and Results
Panelists were selected from the ATLAS MemberClicks database based on predetermined qualifications for each panel type. Individuals first qualified by having more than 3 years of teaching experience, teaching in a DLM state, experience with the DLM alternate assessments, and having no item writer experience in 2019 or 2020. Potential panelists were sorted by grade and subject. Panelists were then assigned to content, accessibility, bias and sensitivity, or text image panels based on their qualifications. For example, those with experience teaching students with disabilities (other than students with significant cognitive disabilities) were prioritized to the accessibility panels, while those with experience teaching students with significant cognitive disabilities were prioritized to the bias and sensitivity panel.
In fall 2020, 57 panelists who had experience with ELA content and/or experience with students with significant cognitive disabilities were recruited to participate. Panelists represented 17 partner states. Three panelists did not indicate their state.
The median and range of years of teaching experience is shown in Table 3.24. The median years of experience for the ELA text panelists was 16 years in pre-K–12 and 15 years in ELA.
| Teaching experience | Median | Range |
|---|---|---|
| Pre-K–12 | 16.0 | 5–38 |
| English language arts | 15.0 | 2–43 |
The 57 ELA text panelists represented a highly qualified group of professionals. The level and most common types of degrees held by panelists are shown in Table 3.25 and Table 3.26, respectively. A majority (n = 53; 93%) held a master’s degree, for which the most common field of study was special education (n = 21; 30%).
| Degree | n | % |
|---|---|---|
| Bachelor’s | 3 | 5.3 |
| Master’s | 53 | 93.0 |
| Other | 1 | 1.8 |
| Degree | n | % |
|---|---|---|
| Bachelor’s degree | ||
| Education | 19 | 33.3 |
| Content specific | 1 | 1.8 |
| Special education | 6 | 10.5 |
| Other | 28 | 49.1 |
| Not specified | 3 | 5.3 |
| Master’s degree | ||
| Education | 13 | 24.5 |
| Content specific | 5 | 9.4 |
| Special education | 21 | 39.6 |
| Other | 14 | 26.4 |
ELA text panelists reported a range of experience working with students with different disabilities, as summarized in Table 3.27. ELA text panelists collectively had the most experience working with students with a significant cognitive disability, a mild cognitive disability, or multiple disabilities.
| Disability category | n | % |
|---|---|---|
| Blind/low vision | 30 | 52.6 |
| Deaf/hard of hearing | 22 | 38.6 |
| Emotional disability | 38 | 66.7 |
| Mild cognitive disability | 40 | 70.2 |
| Multiple disabilities | 40 | 70.2 |
| Orthopedic impairment | 20 | 35.1 |
| Other health impairment | 38 | 66.7 |
| Significant cognitive disability | 40 | 70.2 |
| Specific learning disability | 38 | 66.7 |
| Speech impairment | 36 | 63.2 |
| Traumatic brain injury | 19 | 33.3 |
Panelists had varying experience teaching special education, with a median of 10 years of experience, a minimum of 3 years of experience, and a maximum of 30 years of experience.
The professional roles of the ELA text panelists are shown in Table 3.28. Roles include classroom educators, district staff members, state education staff agency, and other (i.e., instructional coach, item developer, university faculty).
| Role | n | % |
|---|---|---|
| Classroom educator | 38 | 66.7 |
| District staff member | 1 | 1.8 |
| State education agency staff | 5 | 8.8 |
| Other | 13 | 22.8 |
Population density of schools in which panelists taught or held a position is reported in Table 3.29. Rural was defined as a population living outside settlements of 1,000 or fewer inhabitants, suburban was defined as an outlying residential area of a city of 2,000–49,000 or more inhabitants, and urban was defined as a city of 50,000 inhabitants or more. The demographics for the ELA text panelists are presented in Table 3.30.
| Population density | n | % |
|---|---|---|
| Rural | 28 | 49.1 |
| Suburban | 14 | 24.6 |
| Urban | 15 | 26.3 |
| n | % | |
|---|---|---|
| Gender | ||
| Female | 52 | 91.2 |
| Male | 4 | 7.0 |
| Chose not to disclose | 1 | 1.8 |
| Race | ||
| White | 49 | 86.0 |
| Asian | 2 | 3.5 |
| African American | 2 | 3.5 |
| American Indian | 1 | 1.8 |
| Native Hawaiian or Pacific Islander | 1 | 1.8 |
| Chose not to disclose | 2 | 3.5 |
| Hispanic ethnicity | ||
| Non-Hispanic | 54 | 94.7 |
| Hispanic | 1 | 1.8 |
| Chose not to disclose | 2 | 3.5 |
Advanced training included panel-specific modules covering the external review criteria and a module containing information about DLM ELA text and testlets. The week before the event, panelists completed an initial review of the texts for their respective grade band assignments. The information covered in the advance training course laid the groundwork for the on-site training. The on-site training objectives were to understand the consensus discussion structure and process, the panel-specific criteria, and the resources used in the review.
Following the completion of the advance training module, the texts were provided to the panelists via a secure file-sharing platform. Panelists used the criteria for their assigned panel type to complete asynchronous reviews. Following asynchronous review, facilitators hosted panel meetings. Additional training on the structure and process of consensus discussions, panel-specific criteria, and resources were provided during the first panel meeting. During the panel meetings, panelists engaged in criteria-based discussion of each text to provide a consensus rating of the text. Panelists also made comments and suggested revisions to words and images. The co-facilitator recorded consensus ratings and recommendations for revision on text-rating sheets. In cases in which panelists recommended revisions, texts were revised to enhance language clarity, cohere with images, or better align with the text criteria. As shown in Table 3.31, panelists either rated texts as “Accept as is” or “Accept pending revisions.” In some cases, revisions were made to texts that were rated as “Accept as is” by the panelists. This is because certain aspects are meant to be consistent across all texts (e.g., an edit to a character image that appears in multiple texts). Thus, if a revision is recommended for one text, a parallel edit may be made for other texts, even if the other text was rated as “Accept.”
| Panel ratings | Texts accepted as is | Texts revised per panel suggestion | Texts revised per DLM staff suggestion | Texts rejected per panel suggestion | Texts rejected per staff suggestion |
|---|---|---|---|---|---|
| Accept as is | 4 | 0 | 13 | 0 | 0 |
| Revise | 0 | 26 | 0 | 0 | 0 |
| Reject | 0 | 0 | 0 | 0 | 0 |
| Note. Texts can be revised per panel suggestion and per staff suggestion. |
3.4 Alignment of Learning Map Nodes within a Linkage Level and Assessment Items
To ensure the developed testlets are assessing the intended construct, an external alignment study was conducted in 2014–2015 to evaluate the relationship between the DLM assessment contents and the assessed constructs. Briefly, ELA and mathematics testlets from the operational pool were evaluated for alignment with nodes by external partners. The primary measures of alignment were content and performance centrality. Content centrality is a measure of the degree of fidelity between the content of the learning map nodes within a linkage level and the assessment items. Panelists rated each pair as having no link, a far link, or a near link. Performance centrality represents the degree to which the operational assessment item and the corresponding academic grade-level content target contain the same performance expectation. The panelists rated the degree of performance centrality between each pair as none, some, or all.
This section provides a summary of findings from the external alignment study. Full results are provided in the separate technical report (Flowers & Wakeman, 2016a).
Content and performance centrality ratings for the nodes corresponding to the assessment items are reported in Table 3.32 and Table 3.33. Almost all items were rated as having far or near content centrality to the corresponding node, ranging from 97% to 100%. Similarly, the performance centrality ratings indicated that almost all items maintained the performance expectations found in the corresponding linkage level node.
|
No
|
Far
|
Near
|
Met*
|
||||||
|---|---|---|---|---|---|---|---|---|---|
| Pool | Total N | n | % | n | % | n | % | n | % |
| English language arts | 1,516 | 40 | 3 | 115 | 8 | 1,361 | 90 | 1,476 | 97 |
| Mathematics | 925 | 7 | 1 | 41 | 4 | 877 | 95 | 918 | 99 |
| * Met is the total number of items and percentage rated as far or near. | |||||||||
|
No
|
Some
|
All
|
Met*
|
||||||
|---|---|---|---|---|---|---|---|---|---|
| Pool | Total N | n | % | n | % | n | % | n | % |
| English language arts - Fall window | 568 | 11 | 2 | 71 | 13 | 486 | 86 | 557 | 98 |
| English language arts - Spring window | 948 | 17 | 2 | 93 | 10 | 838 | 88 | 931 | 98 |
| Mathematics - Fall window | 516 | 4 | 1 | 17 | 3 | 495 | 96 | 512 | 99 |
| Mathematics - Spring window | 409 | 10 | 3 | 399 | 97 | 409 | 100 | ||
| * Met is the total number of items and percentage rated as some or all. | |||||||||
The percentages of DLM CPD for ELA and math items are reported in Table 3.34. Most ELA items were rated at the Respond through Understand levels, while most math items received ratings from the Remember through the Analyze CPD levels. Most items were located in the middle of the CPD distribution. These results suggest that the items cover a wide range of cognitive complexity and provide opportunities for student with the most significant cognitive disabilities to demonstrate knowledge of appropriately challenging content.
Panelist ratings were compared against the categories identified by DLM item writers. With nine categories in the taxonomy that are potentially appropriate for items, exact and adjacent agreements were calculated. Exact agreement ranged from 77% to 87% of items and adjacent agreement from 82% to 96% of items.
Overall, the external alignment study provides evidence of the DLM system components that connect the Common Core State Standards to the assessment items, via EEs and nodes in linkage levels. The external alignment study provides substantial content-related evidence to support the claims about what students know and can do in ELA and math.
|
English language arts
|
Mathematics
|
|||
|---|---|---|---|---|
| Cognitive Process Dimension | Instructionally embedded % (n = 568) | Spring % (n = 948) | Instructionally embedded % (n = 483) | Spring % (n = 481) |
| Pre-intentional | 0 | 0 | 0 | 0 |
| Attend | 1 | 1 | 1 | 0 |
| Respond | 34 | 34 | 0 | 0 |
| Replicate | 0 | 0 | 1 | 2 |
| Remember | 21 | 18 | 31 | 27 |
| Understand | 40 | 46 | 34 | 34 |
| Apply | 1 | 0 | 18 | 19 |
| Analyze | 3 | 1 | 11 | 15 |
| Evaluate | 0 | 0 | 2 | 4 |
| Create | 0 | 0 | 2 | 0 |
3.5 Evidence of Students’ Response Process
A cognitive lab study was conducted in 2014 to better understand how students interact with technology-enhanced items. The study focused on students’ experience engaging with test content for various item types in computer-administered testlets.
With a move to computer-based testing, many assessment programs have introduced technology-enhanced items. When designing the DLM assessments, the DLM project staff considered the potential trade-offs of these new item types. On one hand, these items offer a means of assessing student knowledge using fewer items, which minimizes the testing burden on a population that has difficulty with long tests. For example, a student’s ability to classify objects could be assessed through a series of multiple-choice items or through one item that involves sorting objects into categories. However, one concern about technology-enhanced item types was that they would be challenging for students with the most significant cognitive disabilities in terms of cognitive demands of the items, lack of familiarity, and the physical access barriers related to students’ fine motor skills.
The purpose of this study was to evaluate whether the construct-irrelevant item response demands presented barriers during the response process. Cognitive labs are typically used to elicit statements that allow the observer to know whether the item is tapping the intended cognitive process (Ericsson & Simon, 1993). Due to the challenges in getting students with the most significant cognitive disabilities to verbalize in this manner (Altman et al., 2010), the study included both observational data collection and post-hoc interview questions.
Labs were conducted with 27 students from multiple states in spring 2014 and spring 2015. Eligible students were from tested grades (Grades 3–8 and high school) and had sufficient symbolic communication systems to be able to interact with the content of onscreen items without physical assistance through keyboard and mouse, tablet, or other assistive technology. Inclusion criteria also required that the students have some verbal expressive communication and were able to interact with the testing device without physical assistance.
Labs focused on student interaction with two types of technology-enhanced items, including select-text and multiple-choice multiple-select item types. The first select-text item types were designed specifically for DLM assessments and are delivered through an online testing platform designed for this population. The select-text item type is only used in some ELA assessments. In a select-text item, answer options are marked in a text selection with boxes around words, phrases, or sentences. When a student makes a selection, the word, phrase, or sentence is highlighted in yellow. To clear a selection, the student clicks it again. Multiple-choice multiple-select items were also constructed to access a response process requiring the student to select all of the answer options that matched a category. To avoid relying on items that might be too difficult and therefore inappropriate for use in cognitive labs (Johnstone et al., 2011), the labs used four-item testlets with content that did not rely on prior academic knowledge. Figure 3.20 shows a select-text item that was constructed to minimize the need for prior knowledge.
Figure 3.20: Sample Select-Text Item
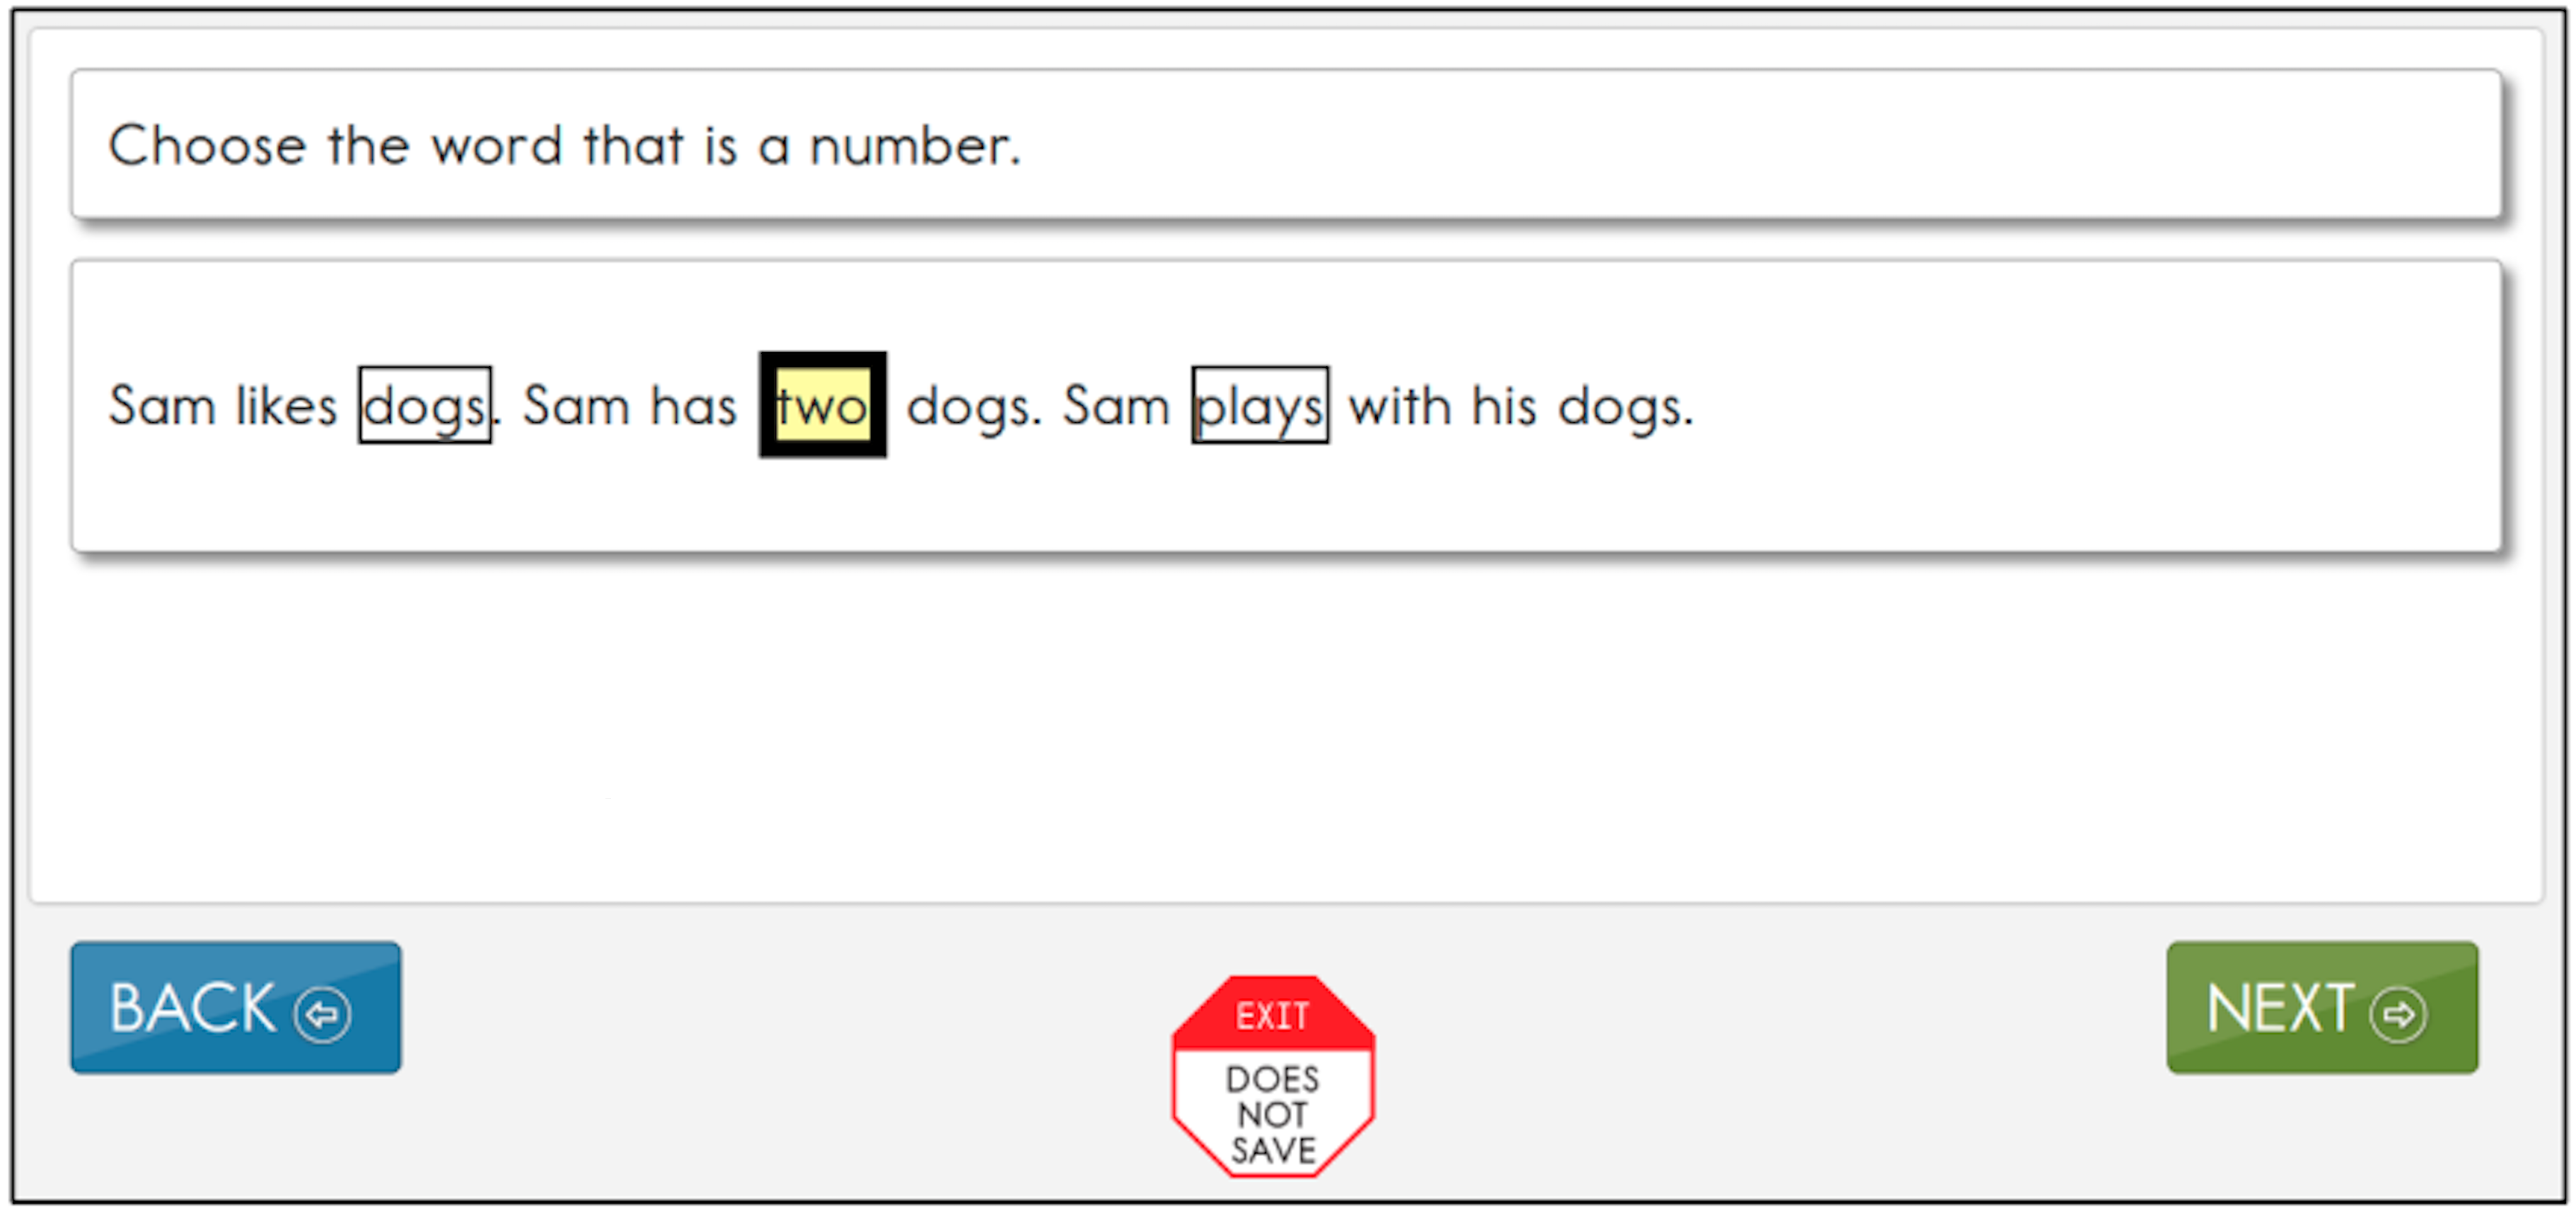
Each testlet contained one type of item. For select-text items, the number of objects to sort and the number of categories varied, with more complex versions of the item type appearing later in the testlet. Each student completed two testlets (one per item type) and the order of presentation of testlet assignments was counterbalanced. Eight students completed select-text testlets and 11 students completed multiple-choice multiple-select testlets. The eight students who completed select-text testlets also completed a testlet that used the same content as the select-text items but presented the content in a traditional, single-select multiple-choice format.
For each item type, the examiner looked for evidence of challenge with each step of the item completion process and for evidence indicating whether the student experienced challenges based on the number of objects to be manipulated per item. For all item types, the examiner also looked for evidence of the student’s understanding of the task. If the student was not able to complete the task without assistance, the examiner provided additional instructions on how to complete the task.
Students were not asked to talk while they completed the items because of to the potential to increase cognitive load. Instead, they were asked questions at the end of each testlet and after the session. These questions were simpler than those described by Altman et al. [-Altman et al. (2010); e.g., “What makes you believe that answer is the right one?”) and only required yes/no responses (e.g., “Did you know what to do?”]. Students were asked the same four questions in the same sequence each time. The yes/no response requirement and identical sequence requirement parallel instructional practice for many students who are eligible for alternate assessments based on alternate achievement standards.
Video recordings of the administrations were reviewed to confirm that the ratings of potential sources of challenge were correctly recorded by the observer. Results reported in this section consist of descriptive statistics for items in the observation protocol and frequency distributions for students’ responses to interview questions.
Sources of challenge in responding to multiple-choice multiple-select items were examined by observing student difficulty with the selection of the first object and the subsequent object(s), the concept of needing to make more than one selection, and need of assistance to complete the item. A summary of the sources of challenge in responding to multiple-choice multiple-select items is shown in Table 3.35. On 41% of the items, students had difficulty with the concept of making multiple selections.
| Source of challenge | n | % |
|---|---|---|
| Difficulty with selection of first object | 4 | 9.0 |
| Difficulty with selection of subsequent objects | 6 | 13.6 |
| Difficulty with multiple-select concept | 18 | 40.9 |
| Needed assistance to complete | 9 | 20.5 |
| Note. N = 11 students, 44 items. One testlet was not completed. |
The select-text item type required less manipulation of onscreen content and only one selection to respond to the item. Across eight students and 32 items, there were only two items (6.3%) for which the student had difficulty selecting the box and two items (6.3%) for which the student needed assistance to complete the item.
Finally, Table 3.36 summarizes student responses to post-hoc interview questions. For both select-text and multiple-choice multiple-select items, students liked these item types, perceived them as easy, and understood the response process required, with at least 73% of students endorsing each of these responses. Student interview responses were consistent with evaluations of item effectiveness based on sources of challenge noted by the observers.
|
Multiple select
(N = 11) |
Select text
(N = 8) |
|||
|---|---|---|---|---|
| Question | n | % | n | % |
| Did you like it? | 9 | 81.8 | 8 | 100.0 |
| Was it easy? | 10 | 90.9 | 8 | 100.0 |
| Was it hard? | 1 | 9.0 | 1 | 12.5 |
| Did you know what to do? | 8 | 72.7 | 8 | 100.0 |
3.6 Evidence of Item Quality
Testlets are the fundamental unit of the DLM alternate assessments. Each year, testlets are added to and removed from the operational pool to maintain a pool of high-quality testlets. The following sections describe evidence of item quality, including evidence supporting field-test testlets available for administration, a summary of the operational pool, and evidence of differential item functioning (DIF).
3.6.1 Field Testing
Field-test testlets are administered in the DLM assessments to conduct a preliminary evaluation of item quality for EEs assessed at each grade level for ELA and mathematics. In addition to evaluating item quality, field testing is also conducted to deepen operational pools so that multiple testlets are available in each of the instructionally embedded windows, including making more content available at EEs and linkage levels that educators administer to students the most. By deepening the operational pool, testlets can also be evaluated for retirement in instances in which other testlets perform better. Additionally, assigning field-test testlets at adjacent linkage levels helps support future evaluation of the linkage level ordering (see Chapter 2 of this manual).
There are multiple item quality indicators that are reviewed for items on field-test testlets. Items are expected to be appropriately difficult and to function similarly to items measuring the same EE and linkage level. Items are also expected to be consistent with DLM item-writing guidelines and aligned with the assessed node, and the test development team makes decisions of whether to accept or reject the items on the field-test testlets.
For each field-test window, the ELA and mathematics test development teams selected field-test testlets to be assessed for Grades 3–12. In this section, we describe the field tests administered in 2021–2022 and the associated review activities.
3.6.1.1 Description of Field Tests Administered in 2021–2022
The Instructionally Embedded and Year-End assessment models share a common item pool, and testlets field tested during the instructionally embedded assessment window may be eventually promoted to the spring assessment window. Therefore, field testing from both assessment windows is described.
Testlets were made available for field testing based on the availability of field-test content for each EE and linkage level.
During both the fall and spring windows, field-test testlets were administered after blueprint coverage requirements were met. A field-test testlet was assigned for an EE that was assessed during the operational assessment at a linkage level equal or adjacent to the linkage level of the operational testlet.
Table 3.37 summarizes the number of field-test testlets available during 2021–2022. A total of 709 were available across grades, subjects, and windows.
|
Fall window
|
Spring window
|
|||
|---|---|---|---|---|
| Grade | English language arts (n) | Mathematics (n) | English language arts (n) | Mathematics (n) |
| 3 | 18 | 13 | 28 | 19 |
| 4 | 15 | 19 | 20 | 30 |
| 5 | 15 | 18 | 21 | 24 |
| 6 | 17 | 18 | 28 | 19 |
| 7 | 13 | 16 | 21 | 26 |
| 8 | 18 | 18 | 24 | 29 |
| 9 | 15 | 9 | 25 | 18 |
| 10 | 15 | 8 | 25 | 19 |
| 11 | 11 | 8 | 17 | 24 |
| 12 | 11 | 17 | ||
A summary of the demographic breakdown of students completing field-test testlets during 2021–2022 is presented by subject in Table 3.38. Consistent with the DLM population, approximately 67% of students completing field-test testlets were male, approximately 60% were white, and approximately 75% were non-Hispanic. The vast majority of students completing field-test testlets were not English learner eligible or monitored. The students completing field-test testlets were split across the four complexity bands, with most students assigned to Band 1 or Band 2. See Chapter 4 of this manual for a description of the student complexity bands.
|
English language
arts |
Mathematics
|
|||
|---|---|---|---|---|
| Demographic group | n | % | n | % |
| Gender | ||||
| Male | 45,623 | 67.3 | 47,677 | 67.4 |
| Female | 22,071 | 32.6 | 22,950 | 32.5 |
| Nonbinary/undesignated | 72 | 0.1 | 71 | 0.1 |
| Race | ||||
| White | 40,196 | 59.3 | 41,886 | 59.2 |
| African American | 14,046 | 20.7 | 14,639 | 20.7 |
| Two or More Races | 7,115 | 10.5 | 7,456 | 10.5 |
| Asian | 3,755 | 5.5 | 3,940 | 5.6 |
| American Indian | 2,101 | 3.1 | 2,198 | 3.1 |
| Native Hawaiian or Pacific Islander | 399 | 0.6 | 419 | 0.6 |
| Alaska Native | 154 | 0.2 | 160 | 0.2 |
| Hispanic ethnicity | ||||
| Non-Hispanic | 51,415 | 75.9 | 53,493 | 75.7 |
| Hispanic | 16,351 | 24.1 | 17,205 | 24.3 |
| English learning (EL) participation | ||||
| Not EL eligible or monitored | 63,029 | 93.0 | 65,815 | 93.1 |
| EL eligible or monitored | 4,737 | 6.9 | 4,883 | 6.8 |
| English language arts complexity band | ||||
| Foundational | 9,138 | 13.5 | 10,008 | 14.2 |
| Band 1 | 27,625 | 40.8 | 28,099 | 39.7 |
| Band 2 | 24,740 | 36.5 | 25,866 | 36.6 |
| Band 3 | 6,263 | 9.2 | 6,725 | 9.5 |
| Mathematics complexity band | ||||
| Foundational | 9,618 | 14.2 | 10,352 | 14.6 |
| Band 1 | 27,555 | 40.7 | 28,205 | 39.9 |
| Band 2 | 25,486 | 37.6 | 26,604 | 37.6 |
| Band 3 | 5,107 | 7.5 | 5,537 | 7.8 |
| Note. See Chapter 4 of this manual for a description of student complexity bands. | ||||
Participation in field testing was not required, but educators were encouraged to administer all available testlets to their students. Field-test participation rates for ELA and mathematics in the fall and spring windows are shown in Table 3.39. Note that because the Instructionally Embedded and Year-End models share an item pool, participation numbers are combined across all states. In total, 66% of students in ELA and 69% of students in mathematics completed at least one field-test testlet. In the fall window, 76% of field-test testlets had a sample size of at least 20 students (i.e., the threshold for item review). In the spring window, 94% of field-test testlets had a sample size of at least 20 students.
|
Fall window
|
Spring window
|
Combined
|
||||
|---|---|---|---|---|---|---|
| Subject | n | % | n | % | n | % |
| English language arts | 6,635 | 43.9 | 66,417 | 65.7 | 67,766 | 65.7 |
| Mathematics | 5,817 | 39.1 | 69,368 | 68.8 | 70,698 | 68.8 |
3.6.1.2 Field-Test Data Review
Data collected during each field test are compiled, and statistical flags are implemented ahead of test development team review. Flagging criteria serve as a source of evidence for test development teams in evaluating item quality; however, final judgments are content based, taking into account the testlet as a whole, the underlying nodes in the DLM maps that the items were written to assess, and pool depth.
Review of field-test data occurs annually during February and March. This includes data from the immediately preceding fall and spring windows. That is, the review in February and March of 2022 includes field-test data collected during the spring 2021 window and the 2021–2022 fall window. Data that were collected during the 2022 spring window will be reviewed in February and March of 2023, with results included in the 2022–2023 technical manual update.
Test development teams for each subject make four types of item-level decisions as they review field-test items flagged for either a p-value or a standardized difference value beyond the threshold:
- No changes made to item. Test development team decided item can go forward to operational assessment.
- Test development team identified concerns that required modifications. Modifications were clearly identifiable and were likely to improve item performance.
- Test development team identified concerns that required modifications. The content was worth preserving rather than rejecting. Item review may not have clearly pointed to specific edits that were likely to improve the item.
- Rejected item. Test development team determined the item was not worth revising.
For an item to be accepted as is, the test development team had to determine that the item was consistent with DLM item-writing guidelines and that the item was aligned to the node. An item or testlet was rejected completely if it was inconsistent with DLM item-writing guidelines, if the EE and linkage level were covered by other testlets that had better-performing items, or if there was no clear content-based revision to improve the item. In some instances, a decision to reject an item resulted in the rejection of the testlet, as well.
Common reasons for flagging an item for modification included items that were misaligned to the node, distractors that could be argued as partially correct, or unnecessary complexity in the language of the stem. After reviewing flagged items, the reviewers looked at all items rated as three or four within the testlet to help determine whether to retain or reject the testlet. Here, the test development team could elect to keep the testlet (with or without revision) or reject it. If a revision was needed, it was assumed the testlet needed field testing again. The entire testlet was rejected if the test development team determined the flagged items could not be adequately revised.
3.6.1.3 Results of Item Analysis
All items are reviewed by test development teams following field testing. Items were specifically flagged if they met either of the following statistical criteria:
The item was too challenging, as indicated by a p-value of less than .35. This value was selected as the threshold for flagging because most DLM assessment items offer three response options, so a value of less than .35 may indicate less than chance selection of the correct response option.
The item was significantly easier or harder than other items assessing the same EE and linkage level, as indicated by a weighted standardized difference greater than two standard deviations from the mean p-value for that EE and linkage level combination.
Figure 3.21 and Figure 3.22 summarize the p-values for items that met the minimum sample size threshold of 20. Most items fell above the .35 threshold for flagging. In ELA, 955 items (96%) were above the .35 flagging threshold. In mathematics, 643 items (84%) were above the .35 flagging threshold. Test development teams for each subject reviewed items below the threshold, which was 39 items (4%) for ELA and 120 items (16%) for mathematics.
Figure 3.21: p-values for English Language Arts Field-Test Items
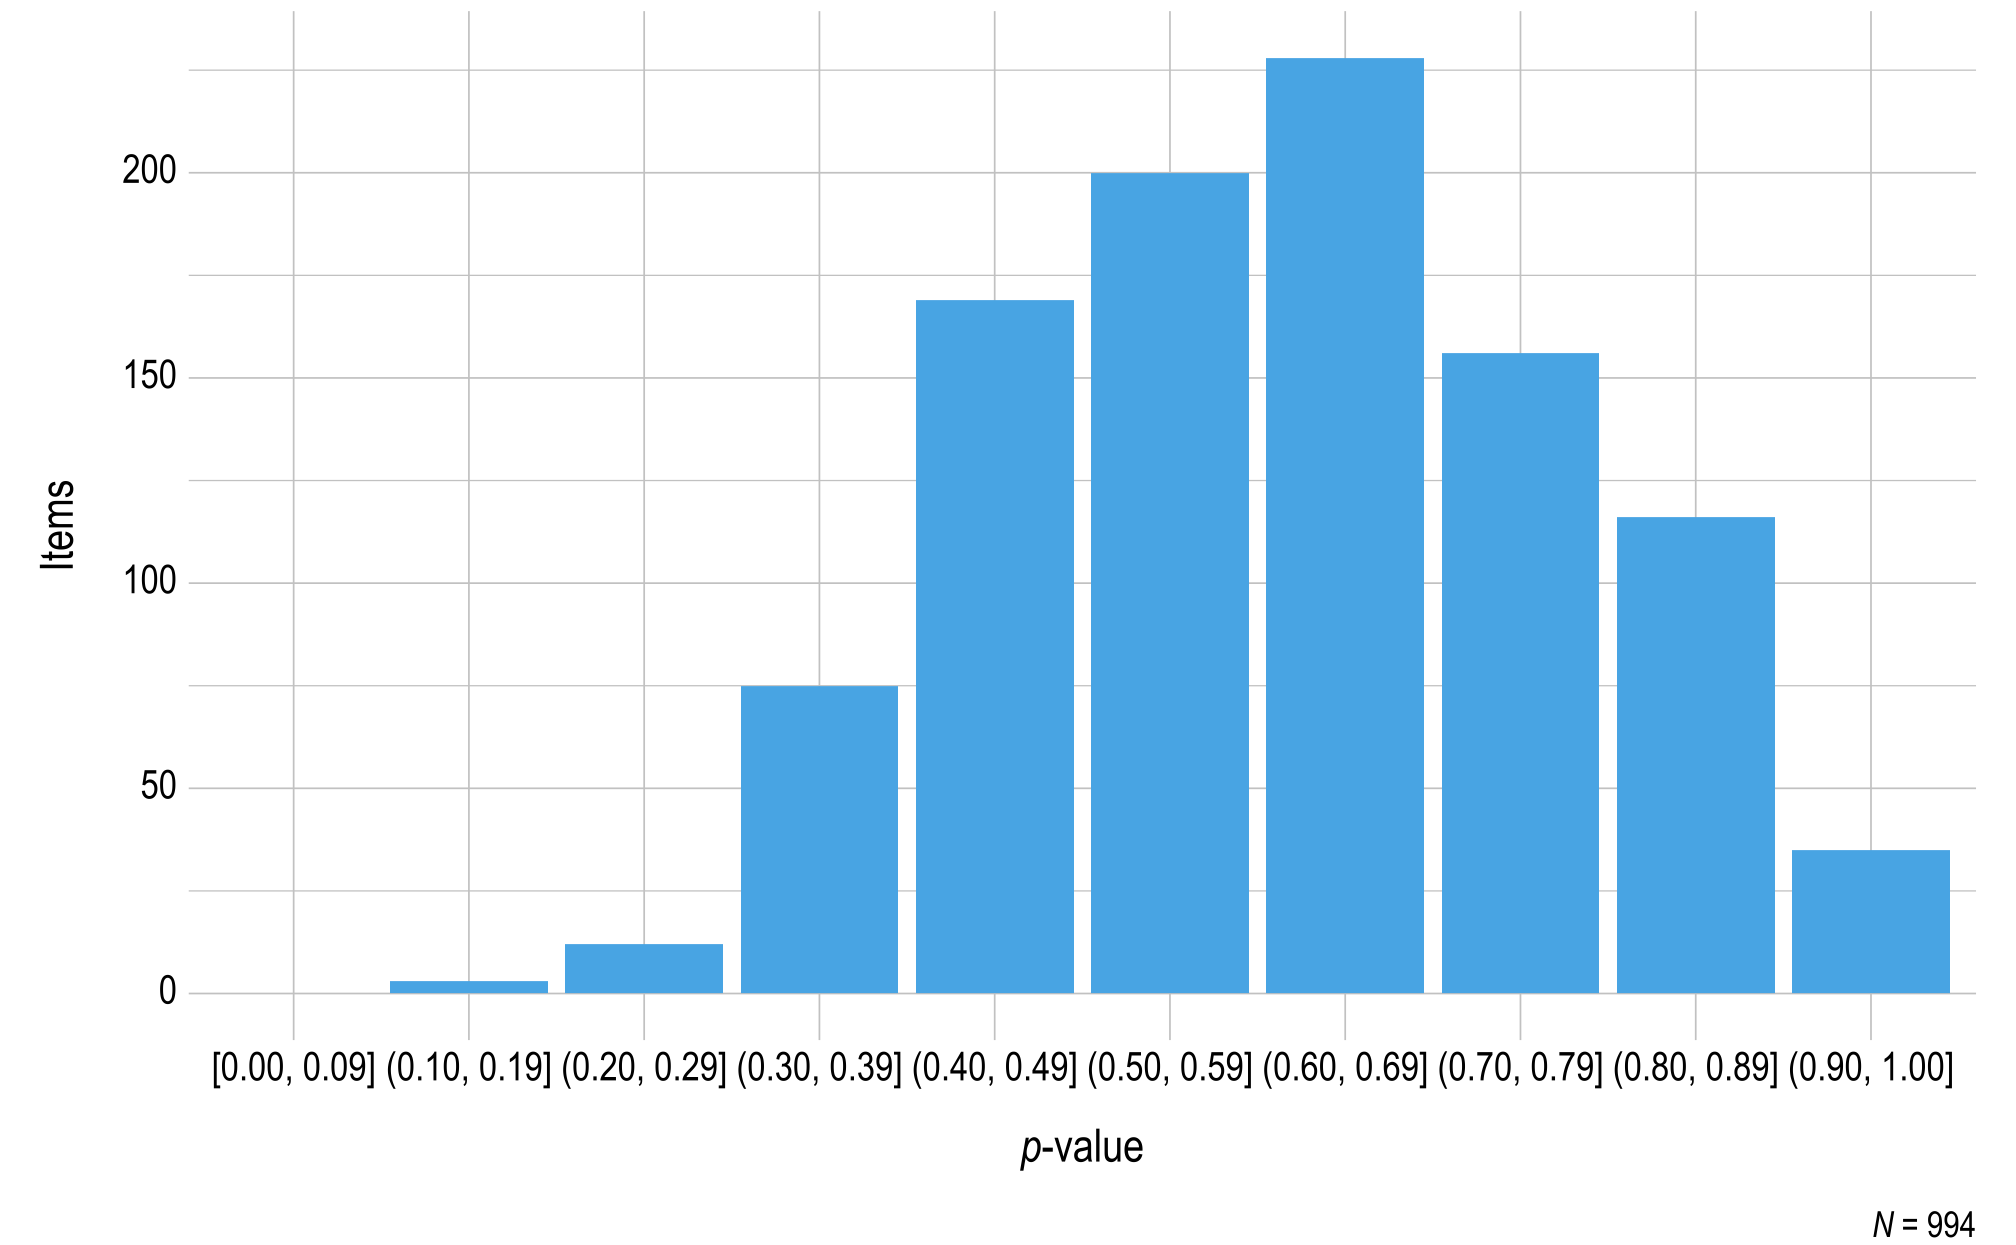
Note. Items with a sample size of less than 20 were omitted.
Figure 3.22: p-values for Mathematics Field-Test Items
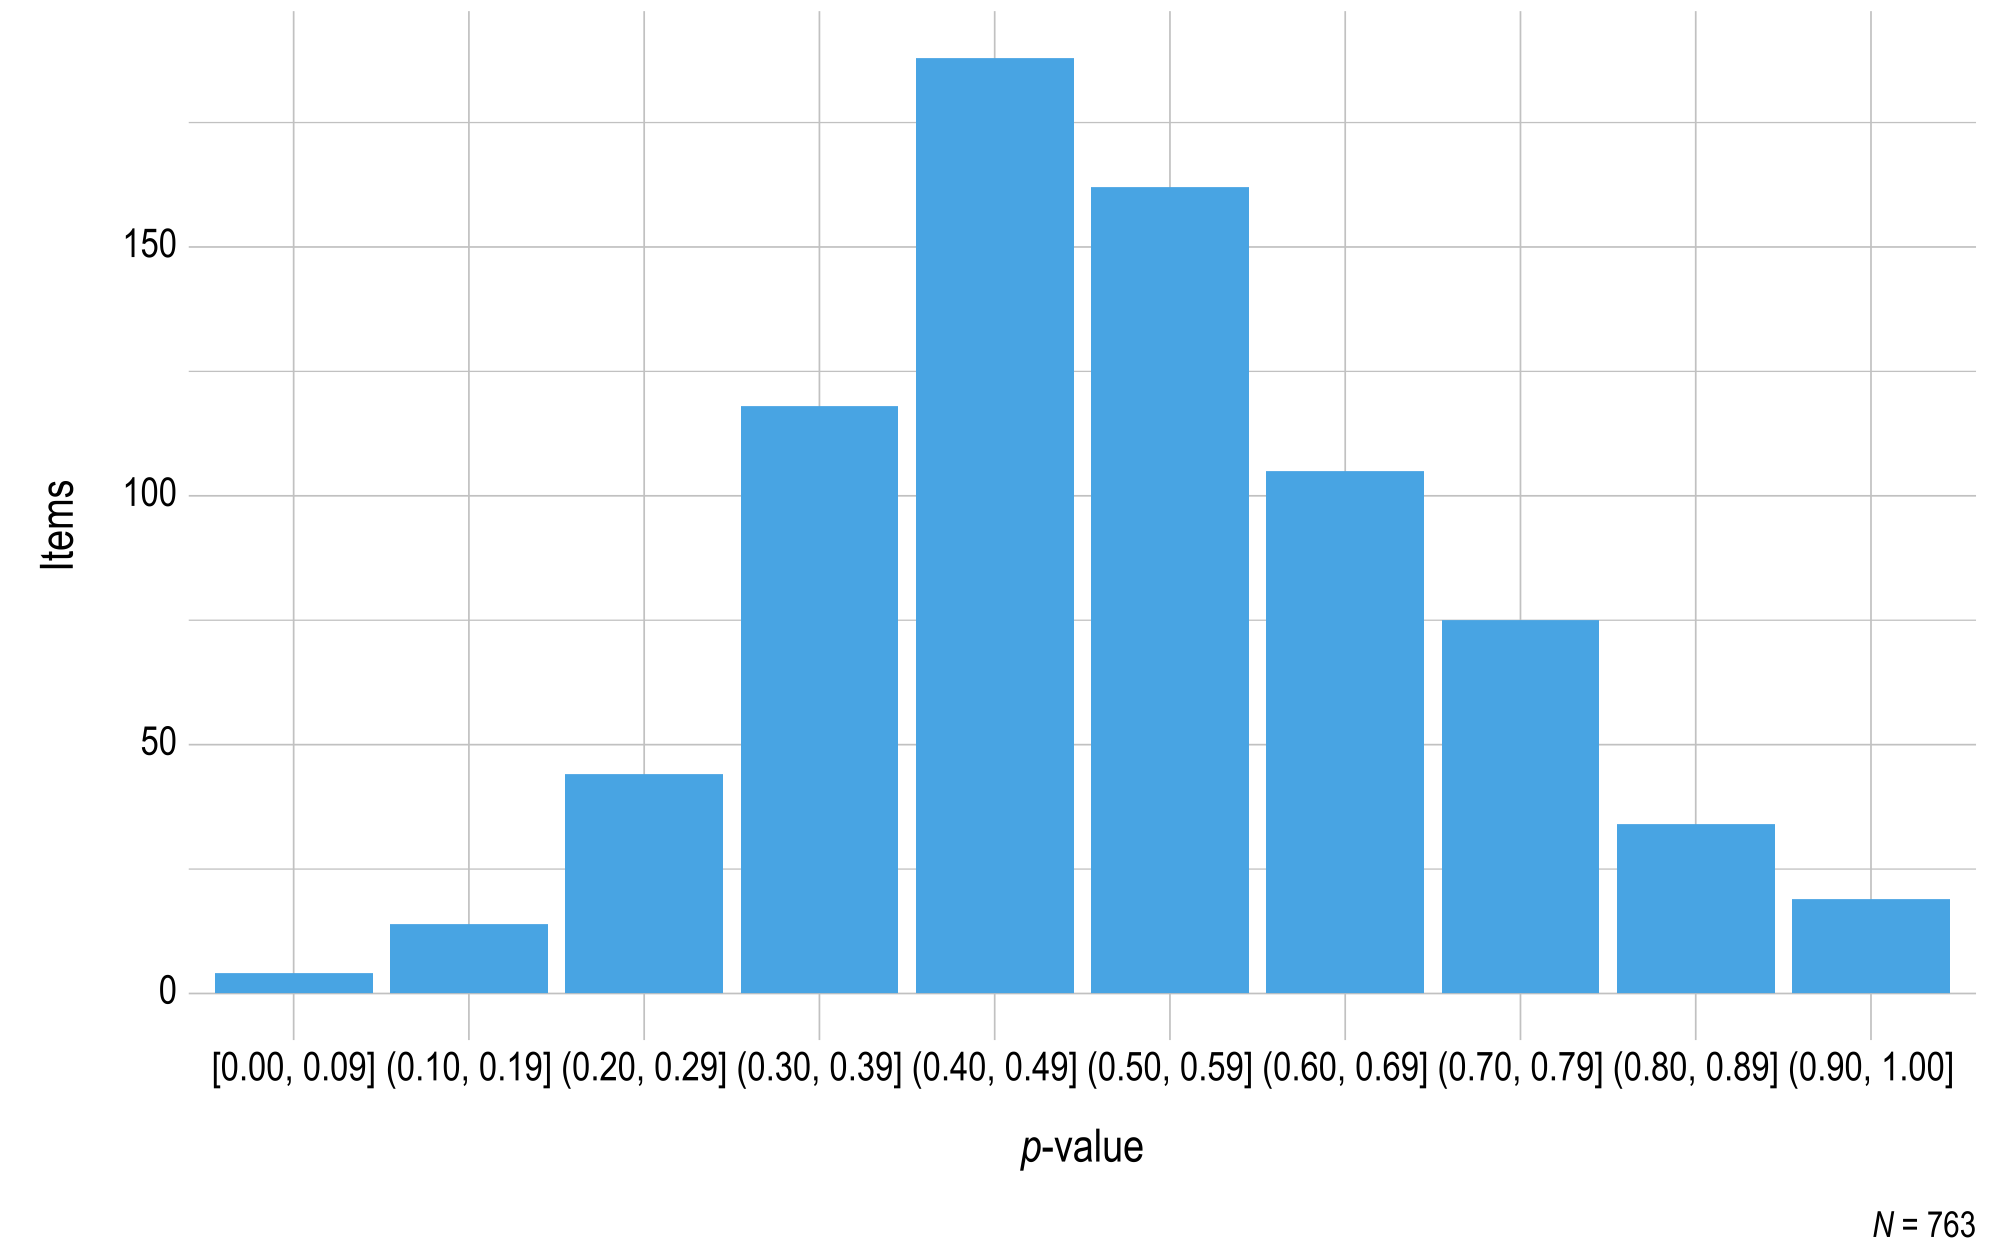
Note. Items with a sample size of less than 20 were omitted.
Figure 3.23 and Figure 3.24 summarize the standardized difference values for items field tested during the instructionally embedded window for ELA and mathematics, respectively. Most items fell within two standard deviations of the mean for the EE and linkage level. Items beyond the threshold were reviewed by test development teams for each subject.
Figure 3.23: Standardized Difference Z-Scores for English Language Arts Field-Test Items
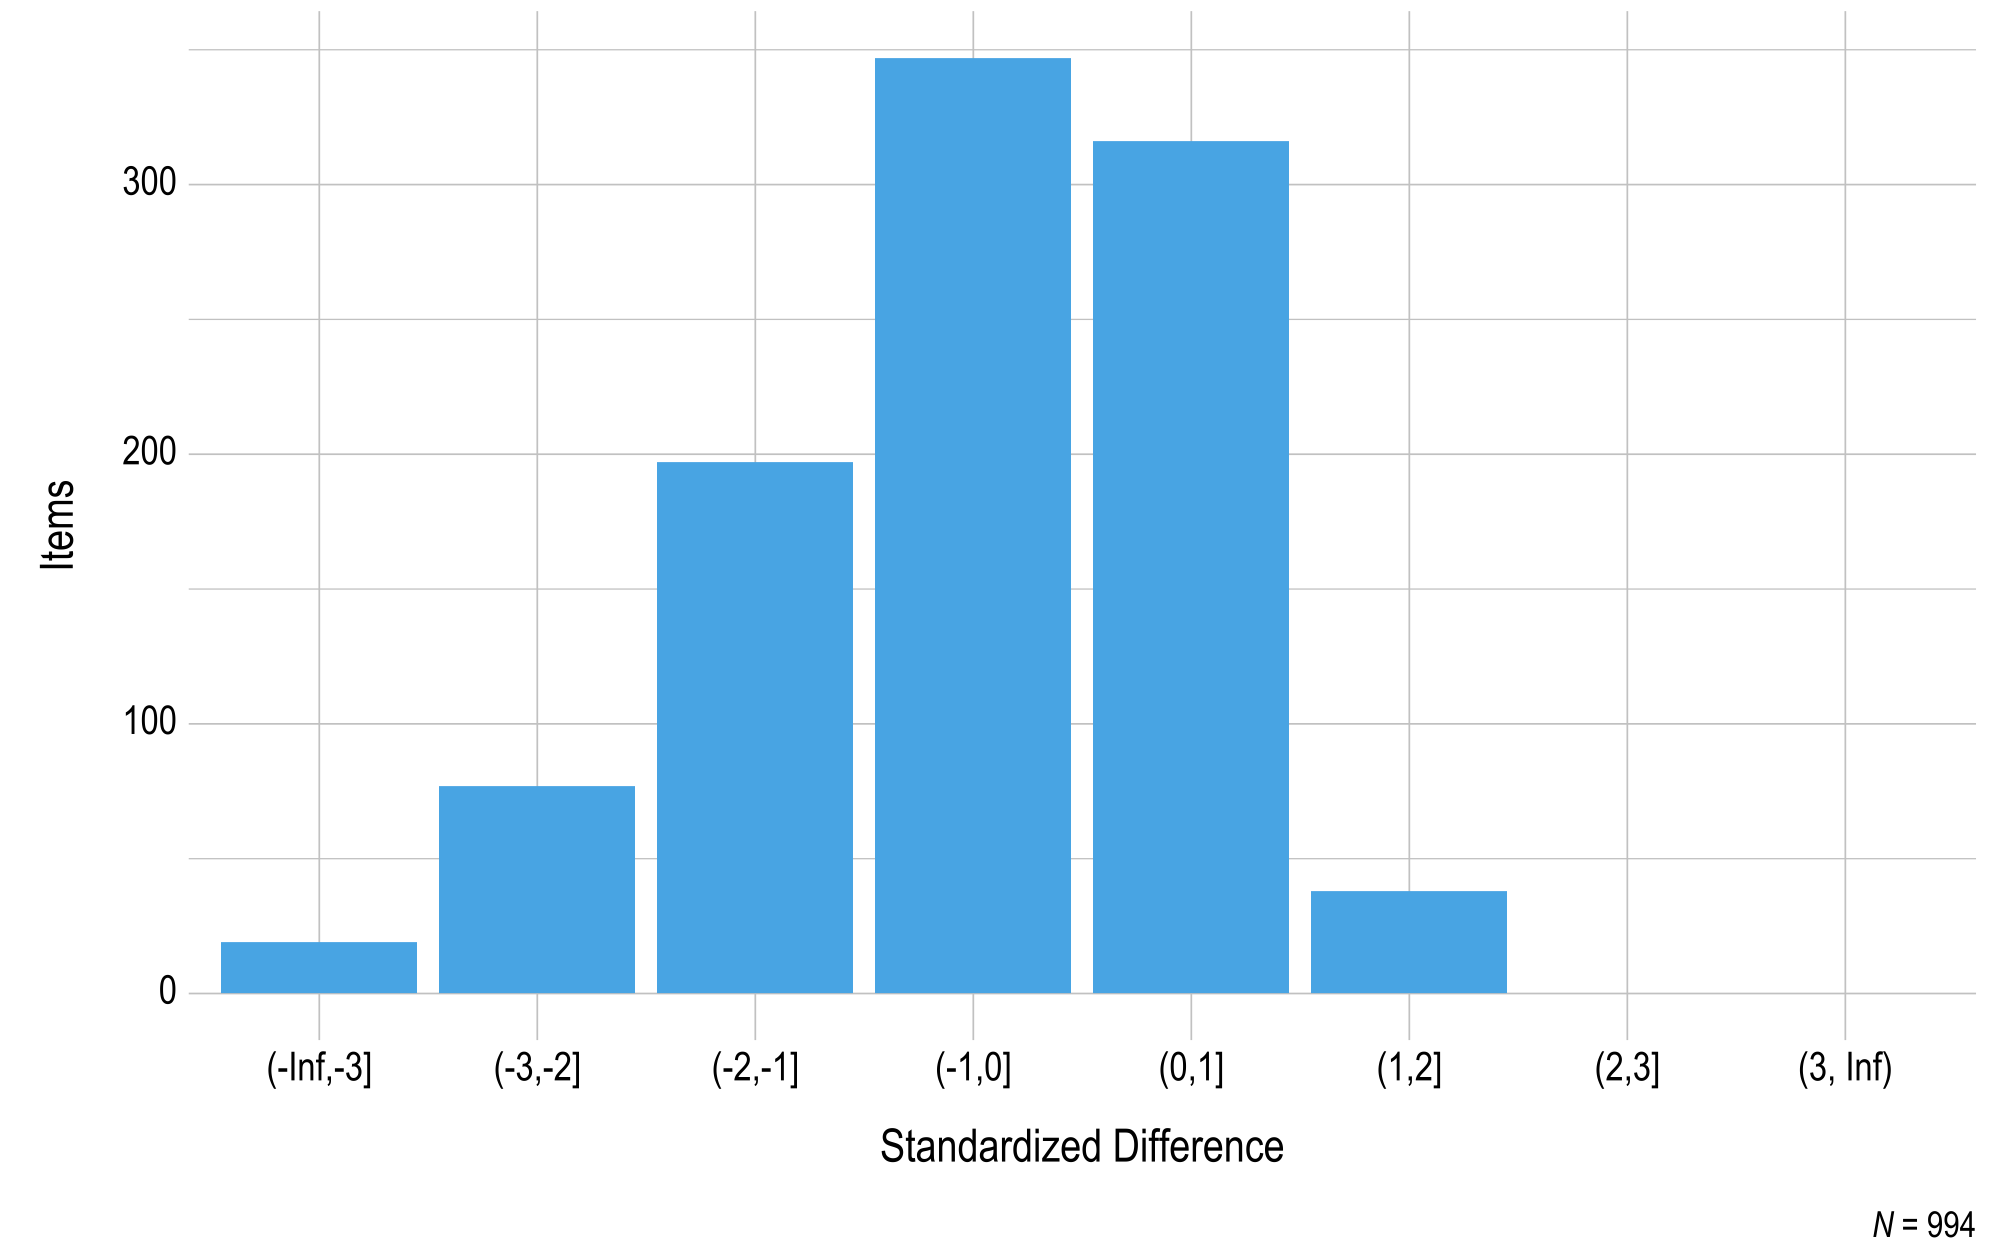
Note. Items with a sample size of less than 20 were omitted.
Figure 3.24: Standardized Difference Z-Scores for Mathematics Field-Test Items
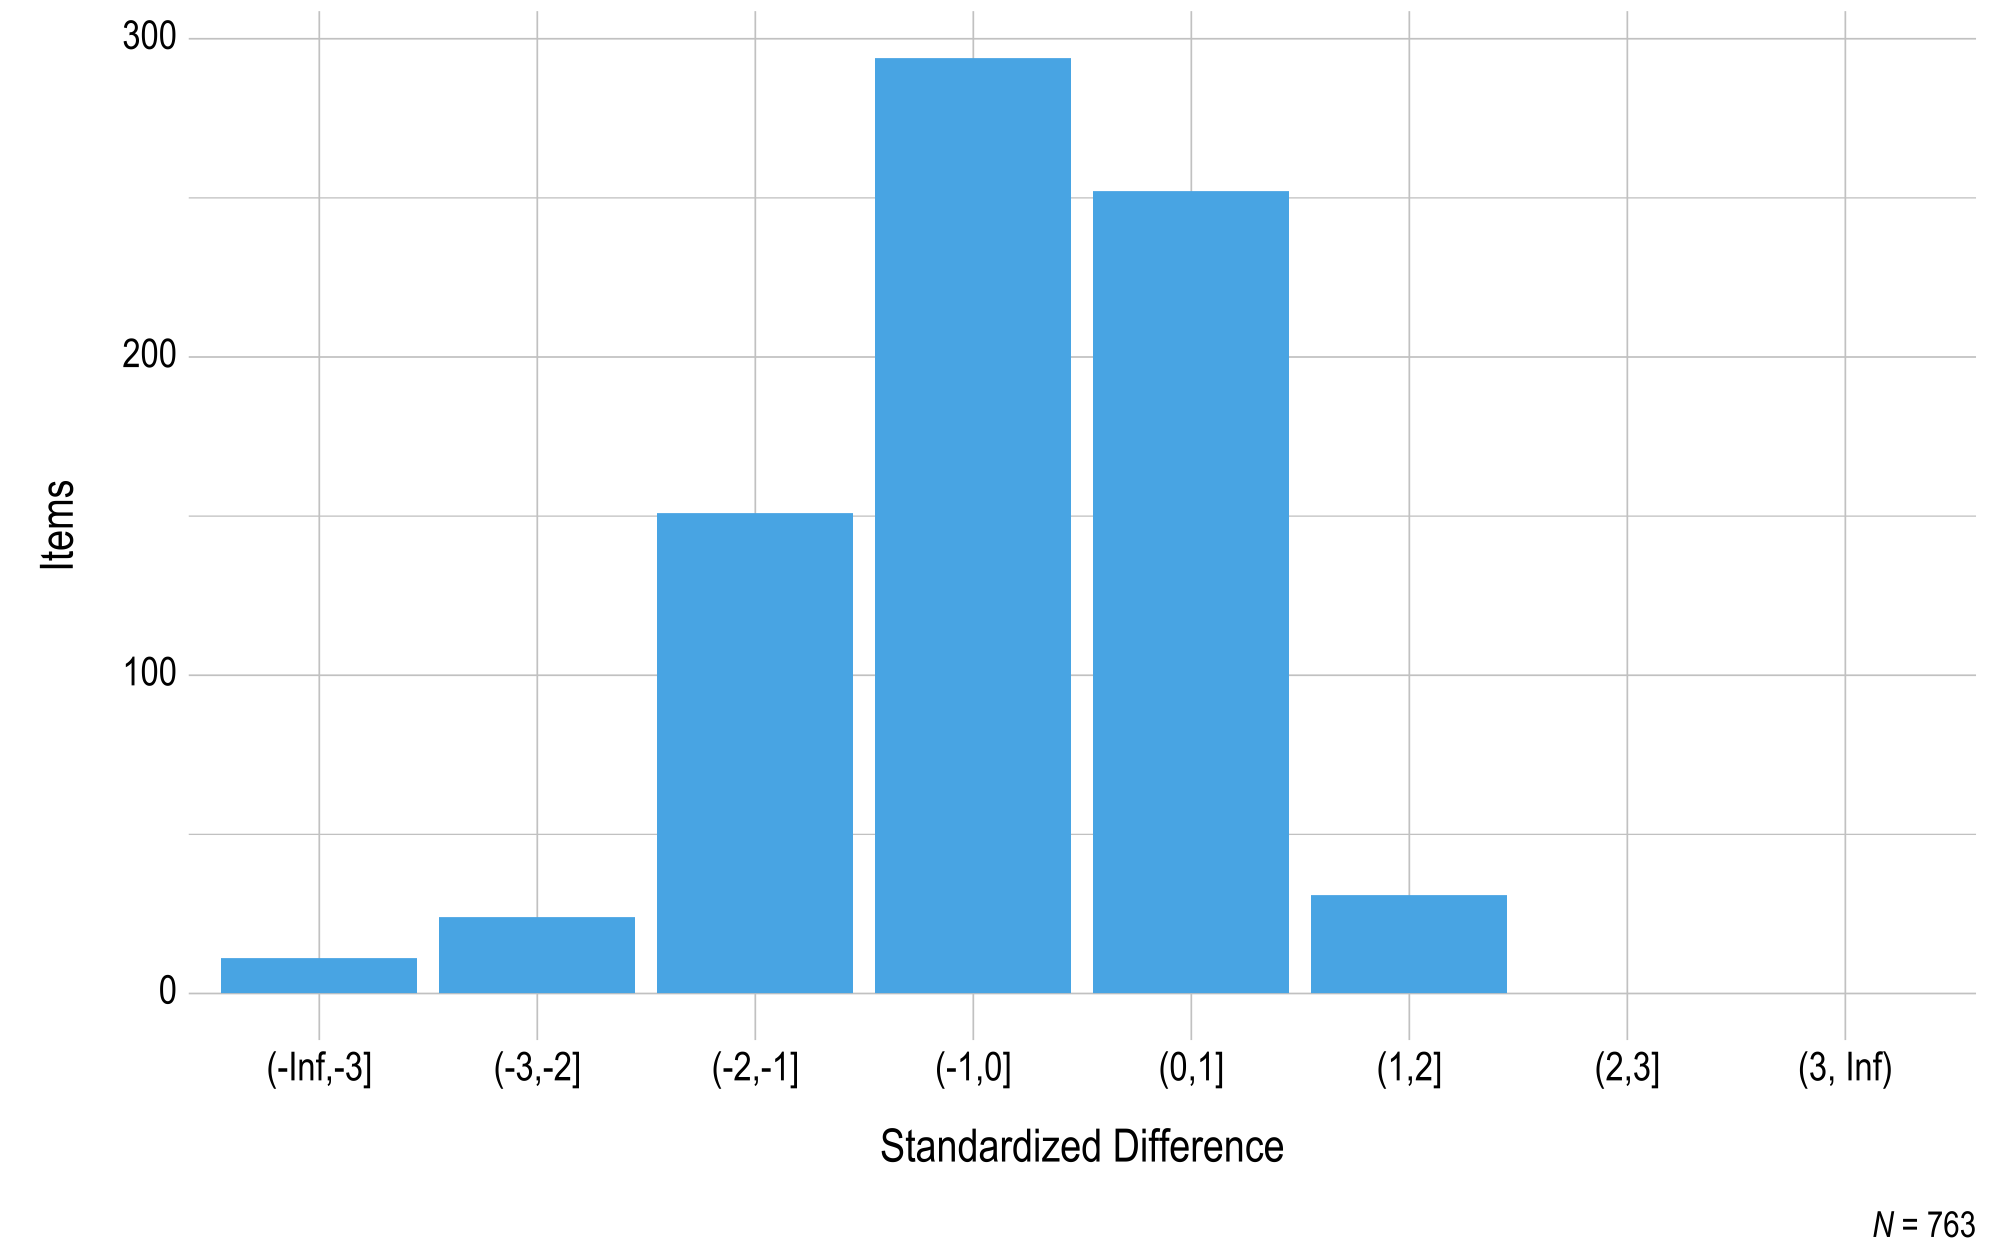
Note. Items with a sample size of less than 20 were omitted.
A total of 70 ELA testlets (36%) and 71 mathematics testlets (43%) had at least one item flagged due to their p-value and/or standardized difference value. Test development teams reviewed all flagged items and their context within the testlet to identify possible reasons for the flag and to determine whether an edit was likely to resolve the issue.
Of the 123 ELA testlets that were not flagged, 21 (17%) were edited and reassigned to the field-test pool for content-based reasons (e.g., changes to item wording), 95 (77%) were promoted to the operational pool, and seven (6%) were sent back to the field-test pool with no edits for additional data collection to get estimates of item difficulty that are based on larger samples. Of the 70 ELA testlets that were flagged, 53 (76%) were edited and reassigned to the field-test pool, 16 (23%) were sent back to the field-test pool with no edits for additional data collection to get estimates of item difficulty that are based on larger samples, and one (1%) was rejected and retired. Of the 94 mathematics testlets that were not flagged, 21 (22%) were edited and reassigned to the field-test pool for content-based reasons, 67 (71%) were promoted to the operational pool, and six (6%) were rejected and retired. Of the 70 mathematics testlets that were flagged, 41 (59%) were edited and reassigned to the field-test pool, 18 (26%) were promoted to the operational pool to maintain pool depth given content-based testlet retirement, five (7%) were sent back to the field-test pool with no edits for additional data collection to get estimates of item difficulty that are based on larger samples, and six (9%) were rejected and retired.
3.6.2 Operational Assessment Items for 2021–2022
The DLM assessments include a total of 3,157 operational testlets, with 1,928 operational ELA testlets and 1,229 operational mathematics testlets. Because the operational pool needs to be deepened, particularly for content at the EEs and linkage levels that educators administer to students the most, updates are made to the operational pool each year. The primary updates are promoting testlets to the operational pool and removing testlets from the operational pool.
Testlets are promoted to the operational pool via field testing, with students in both the fall and spring windows after blueprint coverage requirements were met. Field-test testlets are eligible for review after they have been completed by at least 20 students. As mentioned in the field testing section above (section 3.6.1), there are multiple item quality indicators that are considered when deciding whether to promote an item to the operational pool. Statistically, items are expected to be appropriately difficult and to function similarly to items measuring the same EE and linkage level. To review these statistical item quality indicators, the difficulty and internal consistency of items on field-test testlets are evaluated. Items are also expected to be consistent with DLM item-writing guidelines and aligned with the assessed node. To review these content-based item quality indicators, the quality of the eligible items on the field-test testlets is evaluated, and the test development team makes decisions of whether to accept or reject the items on the field-test testlets. For a full description of field testing, see above in section 3.6.1.
Testlets are removed from the operational pool via retirement based on item quality standards. There are several processes that can lead an item or testlet to be prioritized for retirement. Items are evaluated for evidence of model fit, and the results of these evaluations may be used to prioritize items and testlets for retirement. Items are also evaluated for evidence of DIF, and these results may be used to prioritize items and testlets for retirement. This process is described in section 3.6.3. Finally, the test development team periodically reviews the content pool and prioritizes testlets for retirement. These reviews refresh the operational pool by removing older content when newer content is available.
For 2021–2022, 180 testlets were promoted to the operational pool from field testing in 2020–2021, including 95 ELA testlets and 85 mathematics testlets.
Testlets were made available for operational testing in 2021–2022 based on the 2020–2021 operational pool and the promotion of testlets field-tested during 2020–2021 to the operational pool following their review. Table 3.40 summarizes the total number of operational testlets for 2021–2022. In total, there were 3,157 operational testlets available. This total included 590 EE/linkage level combinations (349 ELA, 241 mathematics) for which both a general version and a version for students who are blind or visually impaired or read braille were available.
|
Fall operational
|
Spring operational
|
|||
|---|---|---|---|---|
| Grade | English language arts (n) | Mathematics (n) | English language arts (n) | Mathematics (n) |
| 3 | 126 | 63 | 128 | 59 |
| 4 | 129 | 88 | 121 | 92 |
| 5 | 153 | 84 | 138 | 88 |
| 6 | 138 | 63 | 127 | 67 |
| 7 | 114 | 84 | 106 | 80 |
| 8 | 124 | 78 | 103 | 76 |
| 9–10 | 110 | 159 | 96 | 148 |
| 11–12 | 114 | * | 101 | * |
| * In mathematics, high school is banded in grades 9–11. | ||||
3.6.2.1 Educator Perception of Assessment Content
Each year, test administrators are asked two questions about their perceptions of the assessment content; Participation in the test administrator survey is described in Chapter 4 of this manual. Table 3.41 describes their responses in 2021–2022. Questions pertained to whether the DLM assessments measured important academic skills and reflected high expectations for their students.
Test administrators generally responded that content reflected high expectations for their students (86% agreed or strongly agreed) and measured important academic skills (78% agreed or strongly agreed). While the majority of test administrators agreed with these statements, 14%–22% disagreed. DLM assessments represent a departure from the breadth of academic skills assessed by many states’ previous alternate assessments. Given the short history of general curriculum access for this population and the tendency to prioritize the instruction of functional academic skills (Karvonen et al., 2011), test administrators’ responses may reflect awareness that DLM assessments contain challenging content. However, test administrators were divided on its importance in the educational programs of students with the most significant cognitive disabilities. Feedback from focus groups with educators focusing on score reports and instructionally embedded assessment reflected similar variability in educator perceptions of assessment content (Clark et al., 2018, 2022).
|
Strongly
disagree |
Disagree
|
Agree
|
Strongly
agree |
|||||
|---|---|---|---|---|---|---|---|---|
| Statement | n | % | n | % | n | % | n | % |
| Content measured important academic skills and knowledge for this student. | 568 | 8.3 | 957 | 14.0 | 4,129 | 60.5 | 1,174 | 17.2 |
| Content reflected high expectations for this student. | 288 | 4.2 | 643 | 9.5 | 4,180 | 61.6 | 1,677 | 24.7 |
3.6.2.2 Psychometric Properties of Operational Assessment Items for 2021–2022
The proportion correct (p-value) was calculated for all operational items to summarize information about item difficulty.
Figure 3.25 and Figure 3.26 include the p-values for each operational item for ELA and mathematics, respectively. To prevent items with small sample sizes from potentially skewing the results, the sample size cutoff for inclusion in the p-value plots was 20. In total, 725 items (7% of all items) were excluded due to small sample size, where 485 of the items were ELA items (8% of all ELA items) and 240 of the items were mathematics items (6% of all mathematics items). In general, ELA items were easier than mathematics items, as evidenced by the presence of more items in the higher bin (p-value) ranges.
Figure 3.25: p-values for English Language Arts 2021–2022 Operational Items
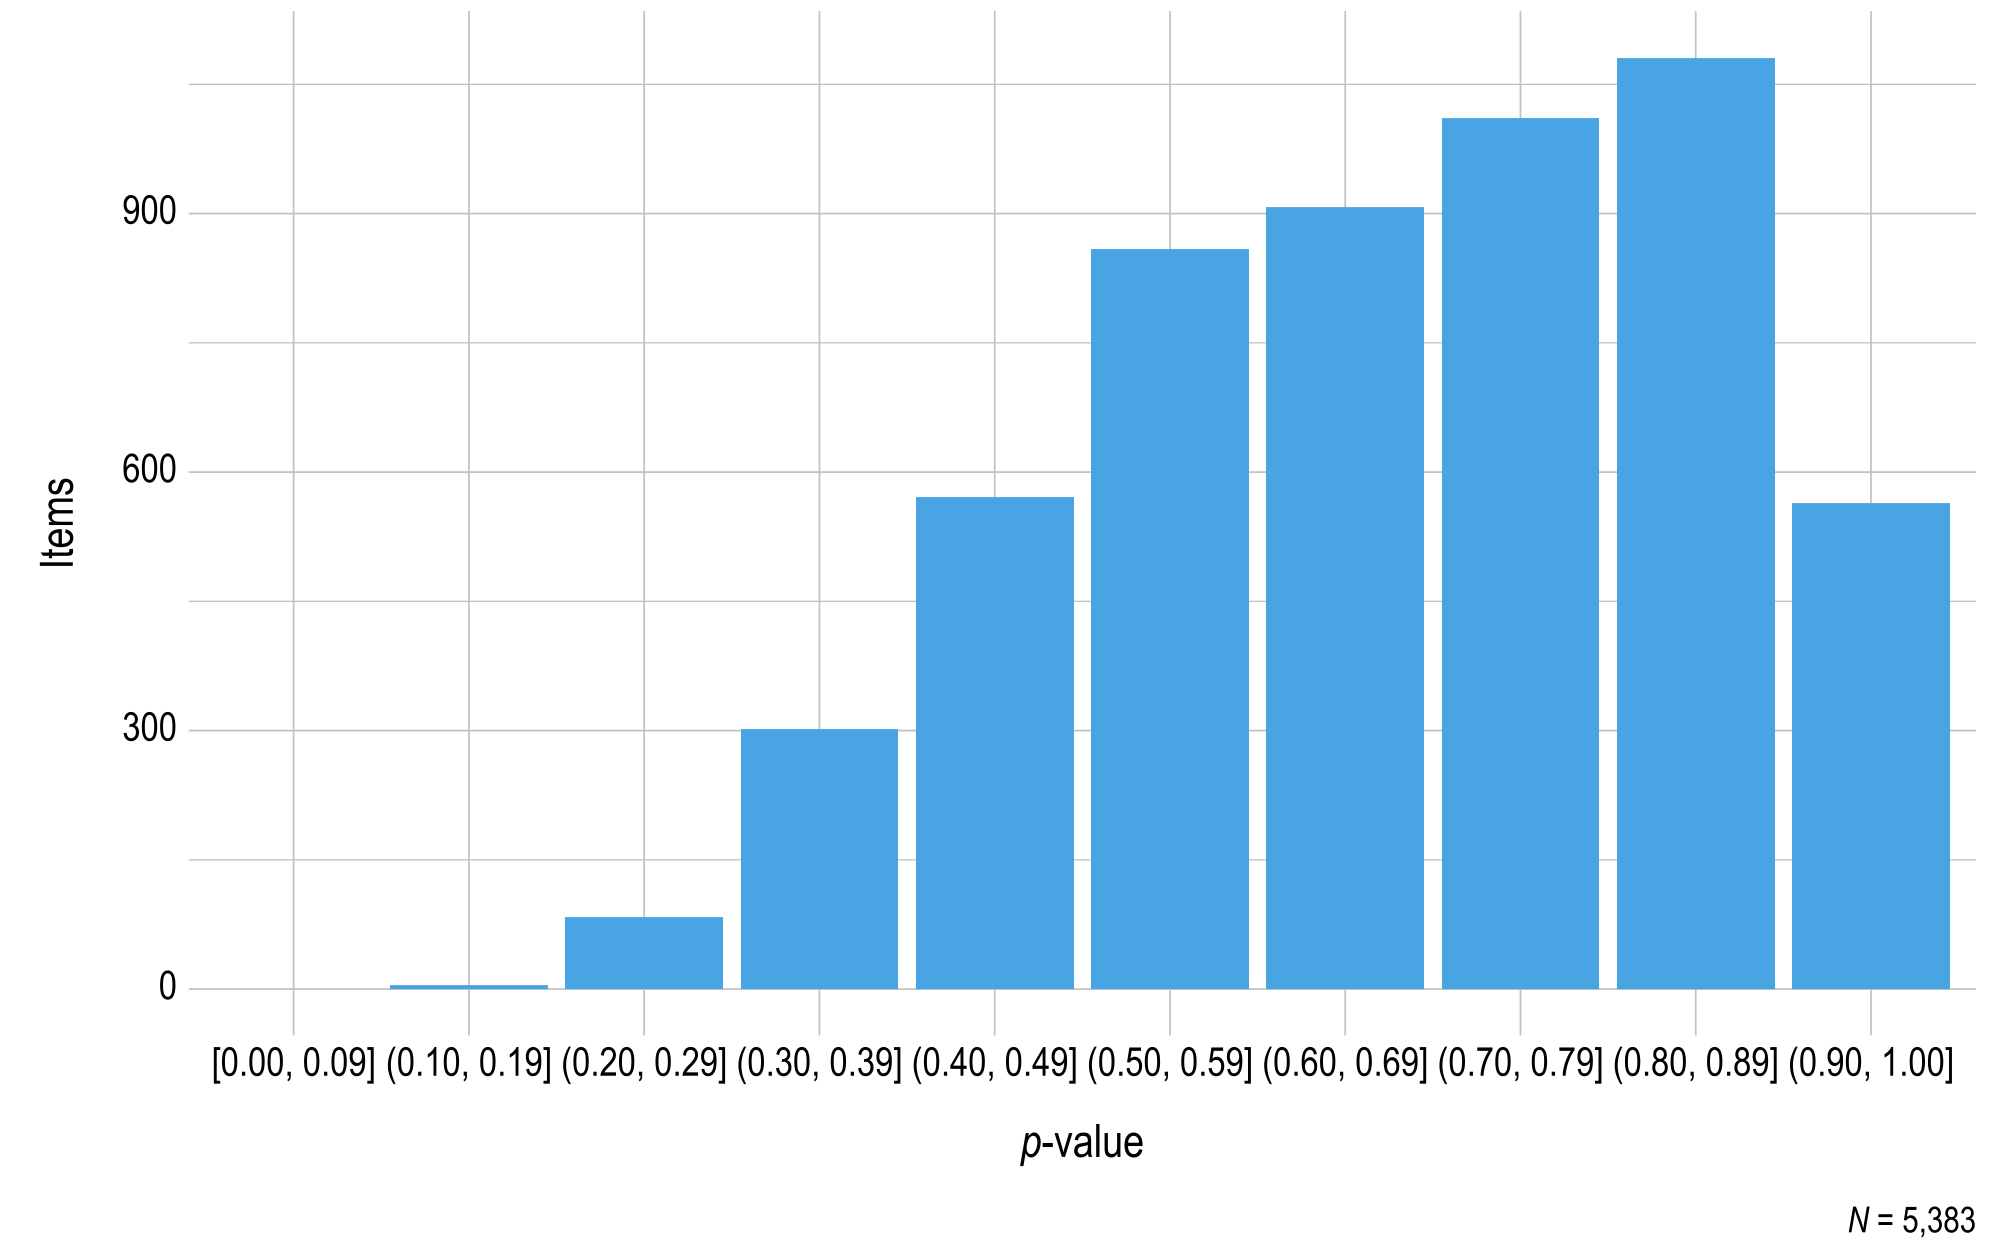
Note. Items with a sample size of less than 20 were omitted.
Figure 3.26: p-values for Mathematics 2021–2022 Operational Items
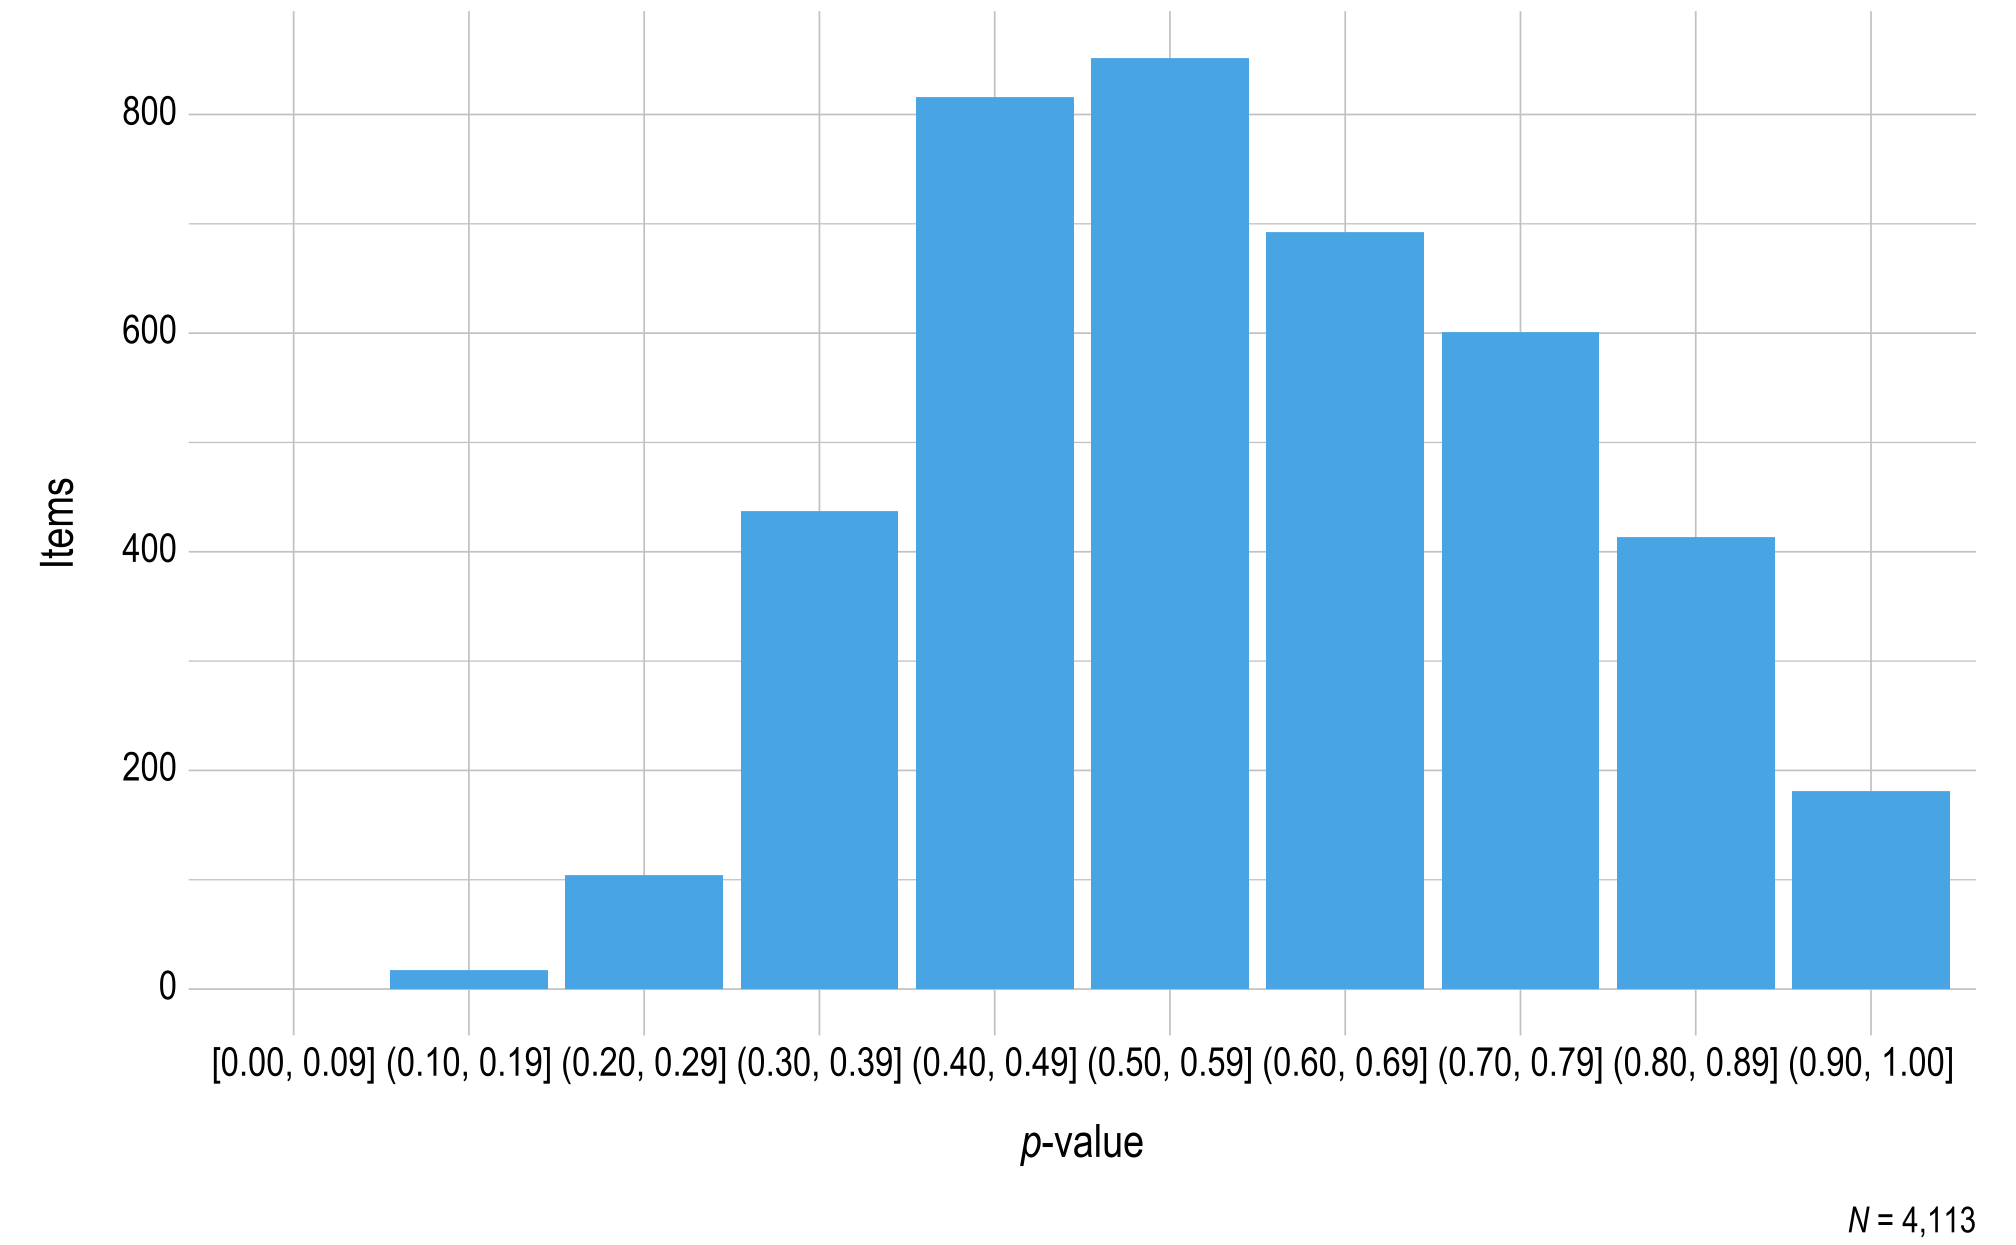
Note. Items with a sample size of less than 20 were omitted.
Items in the DLM assessments are fungible (i.e., interchangeable) within each EE and linkage level, meaning that the items are expected to function identically to the other items measuring the same EE and linkage level. To evaluate the fungibility assumption, standardized difference values were also calculated for all operational items, with a student sample size of at least 20 required to compare the p-value for the item to all other items measuring the same EE and linkage level. If an item is fungible with the other items measuring the same EE and linkage level, the item is expected to have a nonsignificant standardized difference value. The standardized difference values provide one source of evidence of internal consistency.
Figure 3.27 and Figure 3.28 summarize the standardized difference values for operational items for ELA and mathematics, respectively. Of all items measuring the EE and linkage level, 98% of ELA items and 99% of mathematics items fell within two standard deviations of the mean. As additional data are collected and decisions are made regarding item pool replenishment, test development teams will consider item standardized difference values, along with item misfit analyses, when determining which items and testlets are recommended for retirement.
Figure 3.27: Standardized Difference Z-Scores for English Language Arts 2021–2022 Operational Items
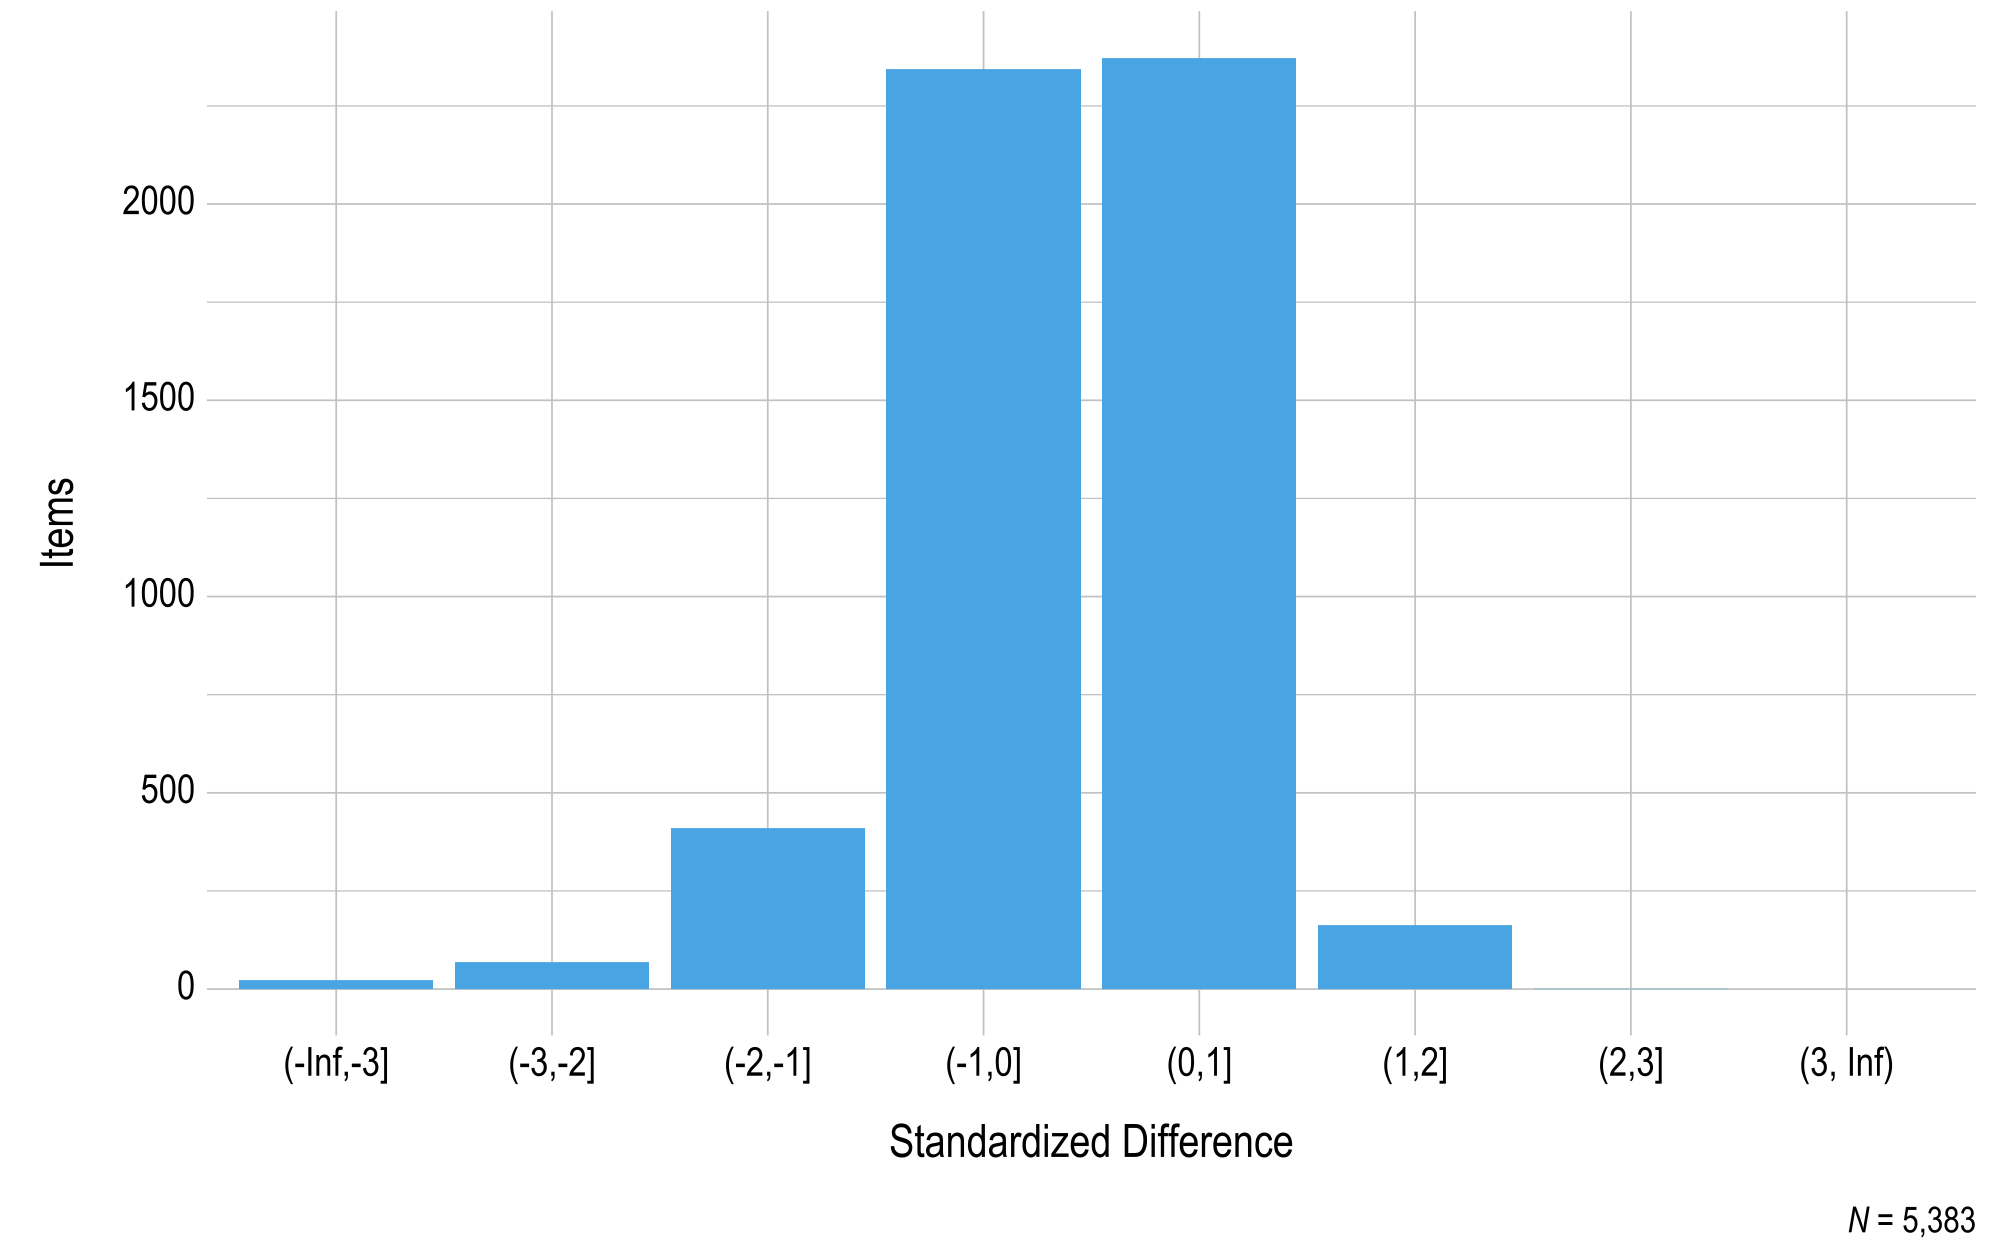
Note. Items with a sample size of less than 20 were omitted.
Figure 3.28: Standardized Difference Z-Scores for Mathematics 2021–2022 Operational Items
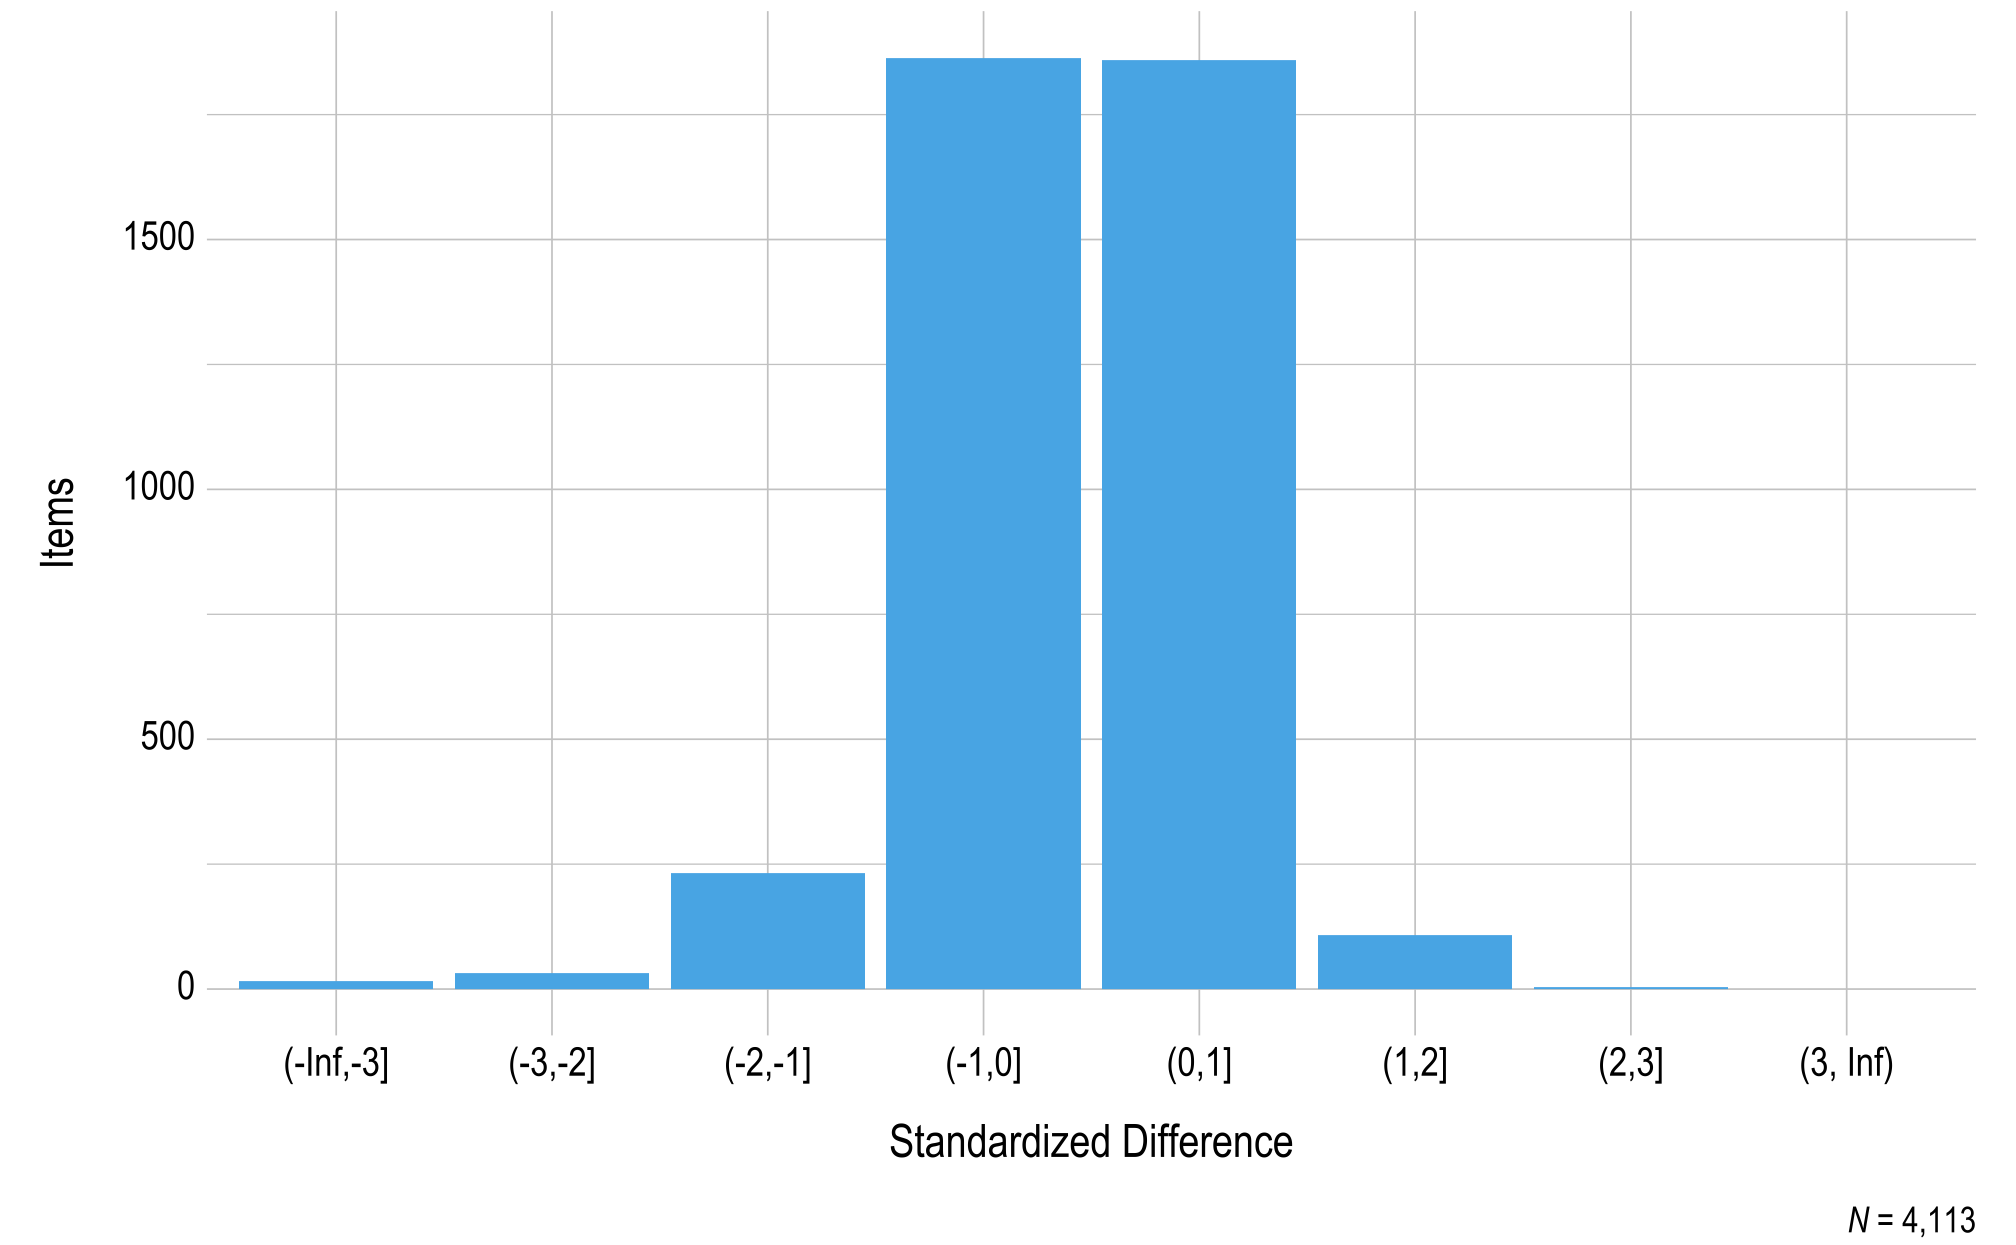
Note. Items with a sample size of less than 20 were omitted.
Figure 3.29 summarizes the standardized difference values for operational items by linkage level. Most items fell within two standard deviations of the mean of all items measuring the respective EE and linkage level, and the distributions are consistent across linkage levels.
Figure 3.29: Standardized Difference Z-Scores for 2021–2022 Operational Items by Linkage Level
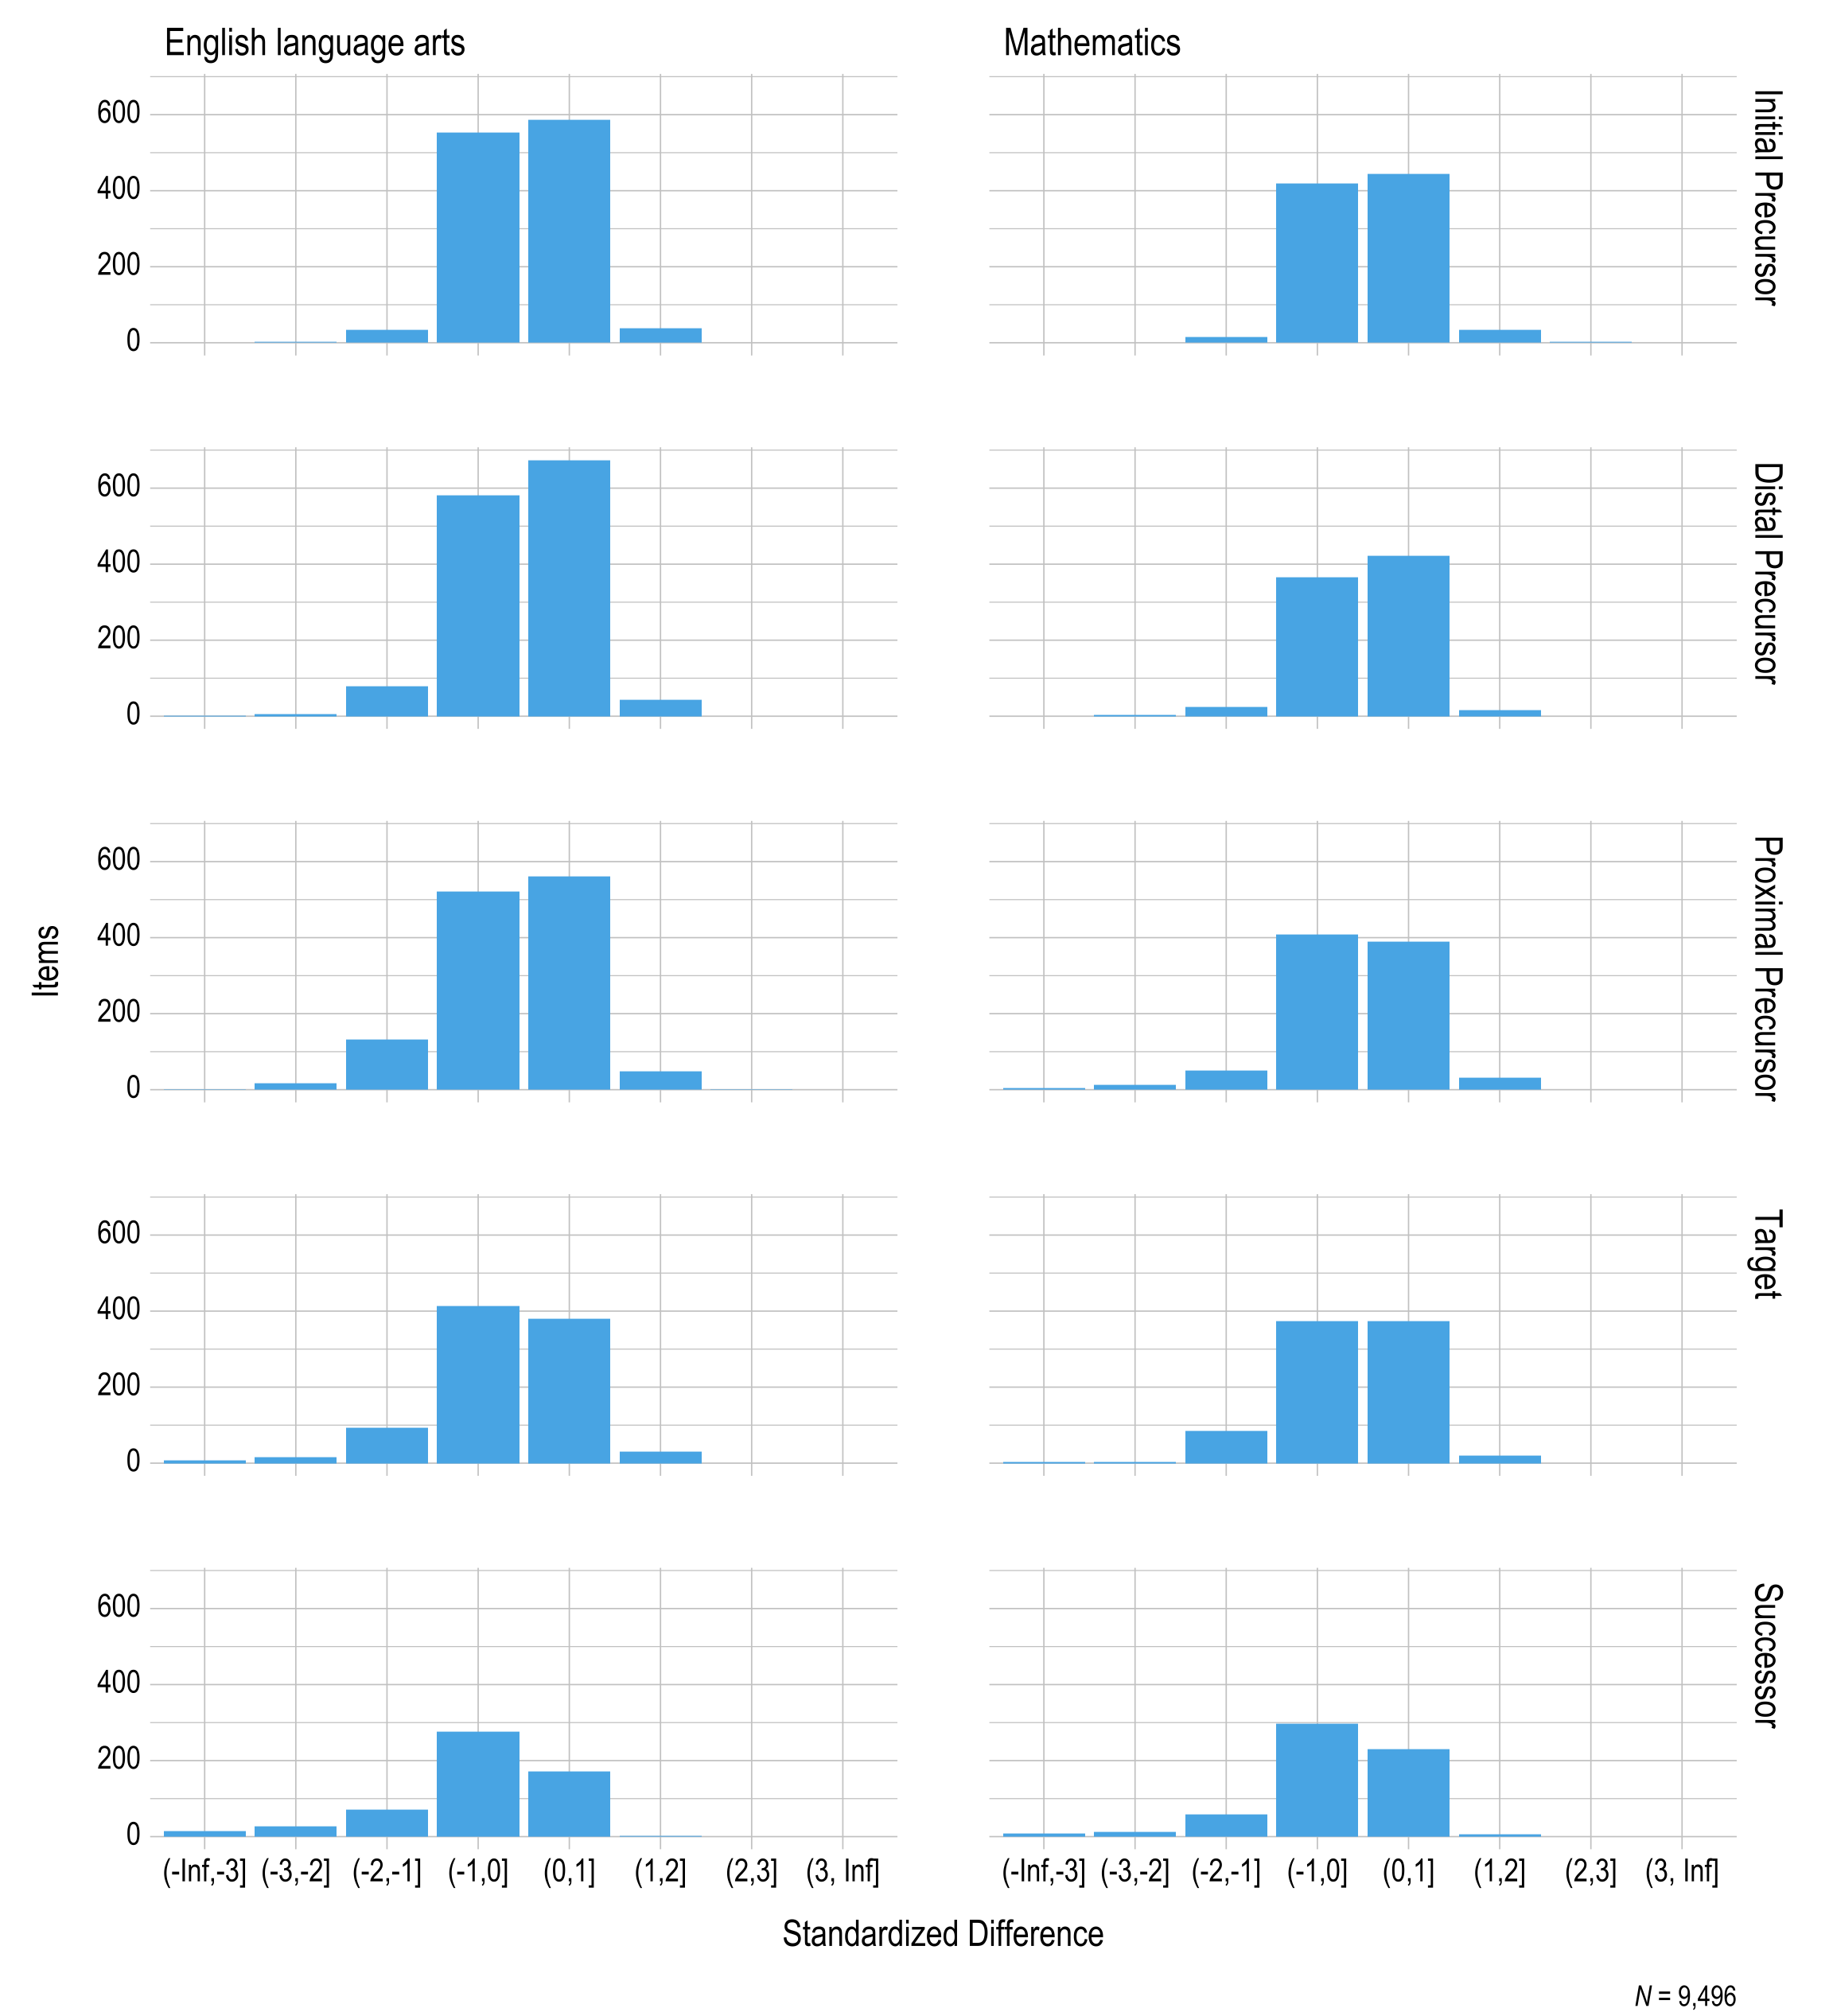
Note. Items with a sample size of less than 20 were omitted.
3.6.3 Evaluation of Item-Level Bias
Analyses comparing how items function across subgroups of students indicate one source of evidence for item quality. Given the heterogeneous nature of the student population, statistical analyses can examine whether particular items function differently for specific subgroups (e.g., male versus female). Each year, DLM assessment items are reviewed for evidence of DIF for gender and ethnicity subgroups. The following sections provide a summary of findings from the evaluation of item-level bias.
DIF addresses the challenges created when some test items are more difficult for some groups of examinees despite these examinees having knowledge and understanding of the assessed concepts (Camilli & Shepard, 1994). DIF analyses can uncover internal inconsistency if particular items are functioning differently in a systematic way for identifiable subgroups of students (American Educational Research Association et al., 2014). While identification of DIF does not always indicate a weakness in the test item, it can point to construct-irrelevant variance, posing considerations for validity and fairness.
3.6.3.1 Method
DIF analyses examined race in addition to gender. Analyses included data from 2015–2016 through 2020–2021 DIF analyses are conducted on the sample of data used to update the model calibration, which uses data through the previous operational assessment. See Chapter 5 of this manual for more information. to flag items for evidence of DIF. Items were selected for inclusion in the DIF analyses based on minimum sample-size requirements for the two gender subgroups (male and female) and for race subgroups: white, African American, Asian, American Indian, Native Hawaiian or Pacific Islander, Alaska Native, and multiple races.
The DLM student population is unbalanced in both gender and race. The number of female students responding to items is smaller than the number of male students by a ratio of approximately 1:2. Similarly, the number of nonwhite students responding to items is smaller than the number of white students by a ratio of approximately 1:2. Therefore, on advice from the DLM Technical Advisory Committee, the threshold for item inclusion requires that the focal group must have at least 100 students responding to the item. The threshold of 100 was selected to balance the need for a sufficient sample size in the focal group with the relatively low number of students responding to many DLM items. Writing items were excluded from the DIF analyses described here because they include nonindependent response options.
Additional criteria were included to prevent estimation errors. Items with an overall proportion correct (p-value) greater than .95 or less than .05 were removed from the analyses. Items for which the p-value for one gender or racial group was greater than .97 or less than .03 were also removed from the analyses.
For each item, logistic regression was used to predict the probability of a correct response, given group membership and performance in the subject. Specifically, the logistic regression equation for each item included a matching variable comprised of the student’s total linkage levels mastered in the subject of the item and a group membership variable, with the reference group (i.e., males for gender, white for race) coded as 1 and the focal group (i.e., females for gender; African American, Asian, American Indian, Native Hawaiian or Pacific Islander, Alaska Native, or two or more races for race) coded as 0. An interaction term was included to evaluate whether nonuniform DIF was present for each item (Swaminathan & Rogers, 1990); the presence of nonuniform DIF indicates that the item functions differently because of the interaction between total linkage levels mastered and the student’s group (i.e., gender or racial group). When nonuniform DIF is present, the group with the highest probability of a correct response to the item differs along the range of total linkage levels mastered; thus, one group is favored at the low end of the spectrum and the other group is favored at the high end.
Three logistic regression models were fitted for each item:
\[\begin{align} \text{M}_0\text{: } \text{logit}(\pi_i) &= \beta_0 + \beta_1\text{X} \tag{3.1} \\ \text{M}_1\text{: } \text{logit}(\pi_i) &= \beta_0 + \beta_1\text{X} + \beta_2G \tag{3.2} \\ \text{M}_2\text{: } \text{logit}(\pi_i) &= \beta_0 + \beta_1\text{X} + \beta_2G + \beta_3\text{X}G\tag{3.3} \end{align}\]where \(\pi_i\) is the probability of a correct response to item i, \(\text{X}\) is the matching criterion, \(G\) is a dummy coded grouping variable (0 = reference group, 1 = focal group), \(\beta_0\) is the intercept, \(\beta_1\) is the slope, \(\beta_2\) is the group-specific parameter, and \(\beta_3\) is the interaction term.
Because of the number of items evaluated for DIF, Type I error rates were susceptible to inflation. The incorporation of an effect-size measure can be used to distinguish practical significance from statistical significance by providing a metric of the magnitude of the effect of adding group and interaction terms to the regression model.
For each item, the change in the Nagelkerke pseudo \(R^2\) measure of effect size was captured, from \(M_0\) to \(M_1\) or \(M_2\), to account for the effect of the addition of the group and interaction terms to the equation. All effect-size values were reported using both the Zumbo and Thomas (1997) and Jodoin and Gierl (2001) indices for reflecting a negligible, moderate, or large effect. The Zumbo and Thomas thresholds for classifying DIF effect size are based on Cohen’s (1992) guidelines for identifying a small, medium, or large effect. The thresholds for each level are .13 and .26; values less than .13 have a negligible effect, values between .13 and .26 have a moderate effect, and values of .26 or greater have a large effect. The Jodoin and Gierl thresholds are more stringent, with lower threshold values of .035 and .07 to distinguish between negligible, moderate, and large effects.
3.6.3.2 Results
Using the above criteria for inclusion, 5,557 (55%) items were selected for gender, and 3,444 (34%) items were selected for at least one racial group comparison. The number of items evaluated by grade and subject for gender ranged from 30 in grades 9–10 ELA to 475 in grades 9–10 mathematics. The number of items evaluated by grade and subject for race ranged from nine in grades 9–10 ELA to 292 in grades 9–10 mathematics. Because students taking DLM assessments represent seven possible racial groups, See Chapter 7 of this manual for a summary of participation by race and other demographic variables. there are up to six comparisons that can be made for each item, with the white group as the reference group and each of the other six groups (i.e., African American, Asian, American Indian, Native Hawaiian or Pacific Islander, Alaska Native, two or more races) as the focal group. Across all items, this results in 141,512 possible comparisons. Using the inclusion criteria specified above, 10,982 (8%) item and focal group comparisons were selected for analysis. Overall, 1,848 items were evaluated for one racial focal group, 1,160 items were evaluated for two racial focal groups, 421 items were evaluated for three racial focal groups, and 15 items were evaluated for four racial focal groups. One racial focal group and the white reference group were used in each comparison. Table 3.42 shows the number of items that were evaluated for each racial focal group. Across all gender and race comparisons, sample sizes for each comparison ranged from 251 to 6,720 for gender and from 412 to 5,708 for race.
| Focal group | Items (n) |
|---|---|
| African American | 3,443 |
| American Indian | 19 |
| Asian | 433 |
| Two or more races | 1,596 |
Of the 4,551 items (45% of the operational item pool) that were not included in the DIF analysis for gender, 4,072 (89%) had a focal group sample size of less than 100, 133 (3%) had an item p-value greater than .95, and 249 (5%) had a subgroup p-value greater than .97. A total of 6,664 items were not included in the DIF analysis for race for any of the subgroups. Of the 55,157 item and focal group comparisons that were not included in the DIF analysis for race, 54,689 (99%) had a focal group sample size of less than 100, 127 (<1%) had an item p-value greater than .95, and 341 (1%) had a subgroup p-value greater than .97. Table 3.43 and Table 3.44 show the number and percentage of items that did not meet each inclusion criteria for gender and race, respectively, by subject and the linkage level the items assess. The majority of nonincluded comparisons come from ELA for both gender (n = 2,984; 66%) and race (n = 32,173; 58%).
|
Sample
size |
Item
proportion correct |
Subgroup
proportion correct |
||||
|---|---|---|---|---|---|---|
| Subject and Linkage Level | n | % | n | % | n | % |
| English language arts | ||||||
| Initial Precursor | 472 | 18.0 | 0 | 0.0 | 0 | 0.0 |
| Distal Precursor | 581 | 22.2 | 0 | 0.0 | 13 | 6.7 |
| Proximal Precursor | 480 | 18.3 | 6 | 6.9 | 79 | 40.5 |
| Target | 492 | 18.8 | 28 | 32.2 | 75 | 38.5 |
| Successor | 598 | 22.8 | 53 | 60.9 | 28 | 14.4 |
| Mathematics | ||||||
| Initial Precursor | 157 | 10.8 | 0 | 0.0 | 0 | 0.0 |
| Distal Precursor | 144 | 9.9 | 0 | 0.0 | 7 | 13.0 |
| Proximal Precursor | 181 | 12.5 | 25 | 54.3 | 13 | 24.1 |
| Target | 374 | 25.8 | 12 | 26.1 | 27 | 50.0 |
| Successor | 593 | 40.9 | 9 | 19.6 | 7 | 13.0 |
|
Sample
size |
Item
proportion correct |
Subgroup
proportion correct |
||||
|---|---|---|---|---|---|---|
| Subject and Linkage Level | n | % | n | % | n | % |
| English language arts | ||||||
| Initial Precursor | 6,485 | 20.3 | 0 | 0.0 | 0 | 0.0 |
| Distal Precursor | 7,593 | 23.8 | 0 | 0.0 | 28 | 12.4 |
| Proximal Precursor | 7,071 | 22.2 | 3 | 4.0 | 90 | 40.0 |
| Target | 5,312 | 16.7 | 17 | 22.7 | 43 | 19.1 |
| Successor | 5,412 | 17.0 | 55 | 73.3 | 64 | 28.4 |
| Mathematics | ||||||
| Initial Precursor | 4,489 | 19.7 | 0 | 0.0 | 2 | 1.7 |
| Distal Precursor | 4,154 | 18.2 | 0 | 0.0 | 19 | 16.4 |
| Proximal Precursor | 4,541 | 19.9 | 29 | 55.8 | 34 | 29.3 |
| Target | 4,890 | 21.4 | 13 | 25.0 | 39 | 33.6 |
| Successor | 4,742 | 20.8 | 10 | 19.2 | 22 | 19.0 |
3.6.3.2.1 Uniform Differential Item Functioning Model
A total of 508 items for gender were flagged for evidence of uniform DIF when comparing \(\text{M}_0\) to \(\text{M}_1\). Additionally, 469 item and focal group combinations across 439 items for race were flagged for evidence of uniform DIF. Table 3.45 and Table 3.46 summarize the total number of combinations flagged for evidence of uniform DIF by subject and grade for gender and race, respectively. The percentage of combinations flagged for uniform DIF ranged from 4% to 14% for gender and from 6% to 20% for race.
| Grade | Items flagged (n) | Total items (N) | Items flagged (%) | Items with moderate or large effect size (n) |
|---|---|---|---|---|
| English language arts | ||||
| 3 | 19 | 330 | 5.8 | 0 |
| 4 | 34 | 362 | 9.4 | 0 |
| 5 | 36 | 385 | 9.4 | 0 |
| 6 | 38 | 414 | 9.2 | 0 |
| 7 | 20 | 371 | 5.4 | 1 |
| 8 | 40 | 354 | 11.3 | 0 |
| 9 | 2 | 22 | 9.1 | 0 |
| 10 | 1 | 8 | 12.5 | 0 |
| 11 | 21 | 148 | 14.2 | 0 |
| 9–10 | 27 | 264 | 10.2 | 0 |
| 11–12 | 11 | 147 | 7.5 | 0 |
| Mathematics | ||||
| 3 | 30 | 260 | 11.5 | 0 |
| 4 | 40 | 373 | 10.7 | 0 |
| 5 | 25 | 393 | 6.4 | 0 |
| 6 | 29 | 309 | 9.4 | 1 |
| 7 | 40 | 335 | 11.9 | 1 |
| 8 | 36 | 364 | 9.9 | 0 |
| 9 | 9 | 227 | 4.0 | 0 |
| 10 | 24 | 248 | 9.7 | 0 |
| 11 | 26 | 243 | 10.7 | 0 |
| Grade | Items flagged (n) | Total items (N) | Items flagged (%) | Items with moderate or large effect size (n) |
|---|---|---|---|---|
| English language arts | ||||
| 3 | 31 | 357 | 8.7 | 0 |
| 4 | 38 | 385 | 9.9 | 0 |
| 5 | 29 | 356 | 8.1 | 0 |
| 6 | 32 | 328 | 9.8 | 0 |
| 7 | 27 | 344 | 7.8 | 0 |
| 8 | 33 | 340 | 9.7 | 0 |
| 9 | 1 | 5 | 20.0 | 0 |
| 11 | 16 | 189 | 8.5 | 0 |
| 9–10 | 19 | 179 | 10.6 | 0 |
| 11–12 | 5 | 72 | 6.9 | 0 |
| Mathematics | ||||
| 3 | 40 | 379 | 10.6 | 0 |
| 4 | 37 | 456 | 8.1 | 0 |
| 5 | 31 | 420 | 7.4 | 0 |
| 6 | 25 | 375 | 6.7 | 0 |
| 7 | 26 | 327 | 8.0 | 0 |
| 8 | 28 | 404 | 6.9 | 0 |
| 9 | 18 | 186 | 9.7 | 0 |
| 10 | 8 | 141 | 5.7 | 0 |
| 11 | 25 | 242 | 10.3 | 0 |
For gender, using the Zumbo and Thomas (1997) effect-size classification criteria, all combinations were found to have a negligible effect-size change after the gender term was added to the regression equation. When using the Jodoin and Gierl (2001) effect-size classification criteria, all but three combinations were found to have a negligible effect-size change after the gender term was added to the regression equation.
The results of the DIF analyses for race were similar to those for gender. When using the Zumbo and Thomas (1997) effect-size classification criteria, all combinations were found to have a negligible effect-size change after the race term was added to the regression equation. Similarly, when using the Jodoin and Gierl (2001) effect-size classification criteria, all combinations were found to have a negligible effect-size change after the race term was added to the regression equation.
Table 3.47 provides information about the flagged items with a non-negligible effect-size change after the addition of the group term, as represented by a value of B (moderate) or C (large). The \(\beta_2G\) values in Table 3.47 indicate which group was favored on the item after accounting for total linkage levels mastered, with positive values indicating that the focal group had a higher probability of success on the item and negative values indicating that the focal group had a lower probability of success on the item. The focal group was favored on one combination.
| Item ID | Focal | Grade | EE | \(\chi^2\) | \(p\)-value | \(\beta_2G\) | \(R^2\) | Z&T* | J&G* | Window |
|---|---|---|---|---|---|---|---|---|---|---|
| English language arts | ||||||||||
| 33860 | Female | 7 | ELA.EE.RL.7.5 | 7.20 | .007 | 0.73 | .036 | A | B | Fall |
| Mathematics | ||||||||||
| 8502 | Female | 6 | M.EE.6.RP.1 | 11.28 | < .001 | −0.88 | .039 | A | B | Spring |
| 37072 | Female | 7 | M.EE.7.SP.3 | 13.49 | < .001 | −0.84 | .044 | A | B | Spring |
| Note. EE = Essential Element; Z&T = Zumbo & Thomas; J&G = Jodoin & Gierl. | ||||||||||
| * Effect-size measure. | ||||||||||
3.6.3.2.2 Combined Model
A total of 634 items were flagged for evidence of DIF when both the gender and interaction terms were included in the regression equation, as shown in Equation (3.3). Additionally, 582 item and focal group combinations across 538 items were flagged for evidence of DIF when both the race and interaction terms were included in the regression equation. Table 3.48 and Table 3.49 summarize the number of combinations flagged by subject and grade. The percentage of combinations flagged ranged from 6% to 16% for gender and from 7% to 20% for race.
| Grade | Items flagged (n) | Total items (N) | Items flagged (%) | Items with moderate or large effect size (n) |
|---|---|---|---|---|
| English language arts | ||||
| 3 | 21 | 330 | 6.4 | 0 |
| 4 | 41 | 362 | 11.3 | 1 |
| 5 | 37 | 385 | 9.6 | 0 |
| 6 | 46 | 414 | 11.1 | 3 |
| 7 | 34 | 371 | 9.2 | 1 |
| 8 | 35 | 354 | 9.9 | 1 |
| 9 | 3 | 22 | 13.6 | 0 |
| 10 | 1 | 8 | 12.5 | 0 |
| 11 | 19 | 148 | 12.8 | 0 |
| 9–10 | 26 | 264 | 9.8 | 0 |
| 11–12 | 16 | 147 | 10.9 | 3 |
| Mathematics | ||||
| 3 | 37 | 260 | 14.2 | 0 |
| 4 | 60 | 373 | 16.1 | 0 |
| 5 | 42 | 393 | 10.7 | 1 |
| 6 | 44 | 309 | 14.2 | 1 |
| 7 | 47 | 335 | 14.0 | 1 |
| 8 | 49 | 364 | 13.5 | 1 |
| 9 | 21 | 227 | 9.3 | 2 |
| 10 | 27 | 248 | 10.9 | 0 |
| 11 | 28 | 243 | 11.5 | 0 |
| Grade | Items flagged (n) | Total items (N) | Items flagged (%) | Items with moderate or large effect size (n) |
|---|---|---|---|---|
| English language arts | ||||
| 3 | 24 | 357 | 6.7 | 0 |
| 4 | 38 | 385 | 9.9 | 0 |
| 5 | 40 | 356 | 11.2 | 0 |
| 6 | 40 | 328 | 12.2 | 1 |
| 7 | 38 | 344 | 11.0 | 0 |
| 8 | 33 | 340 | 9.7 | 1 |
| 9 | 1 | 5 | 20.0 | 0 |
| 11 | 26 | 189 | 13.8 | 0 |
| 9–10 | 23 | 179 | 12.8 | 0 |
| 11–12 | 9 | 72 | 12.5 | 0 |
| Mathematics | ||||
| 3 | 35 | 379 | 9.2 | 0 |
| 4 | 65 | 456 | 14.3 | 0 |
| 5 | 38 | 420 | 9.0 | 0 |
| 6 | 30 | 375 | 8.0 | 0 |
| 7 | 47 | 327 | 14.4 | 0 |
| 8 | 41 | 404 | 10.1 | 0 |
| 9 | 15 | 186 | 8.1 | 0 |
| 10 | 10 | 141 | 7.1 | 0 |
| 11 | 29 | 242 | 12.0 | 0 |
Using the Zumbo and Thomas (1997) effect-size classification criteria, all combinations were found to have a negligible effect-size change after the gender and interaction terms were added to the regression equation. When using the Jodoin and Gierl (2001) effect-size classification criteria, all but 15 combinations were found to have a negligible effect-size change after the gender and interaction terms were added to the regression equation.
The results of the DIF analyses for race were similar to those for gender. When using the Zumbo and Thomas (1997) effect-size classification criteria, all combinations were found to have a negligible effect-size change after the race and interaction terms were added to the regression equation. Similarly, when using the Jodoin and Gierl (2001) effect-size classification criteria, all but two combinations were found to have a negligible effect-size change after the race and interaction terms were added to the regression equation.
Information about the flagged items with a non-negligible change in effect size after adding both the group and interaction term is summarized in Table 3.50, where B indicates a moderate effect size, and C a large effect size. In total, 16 combinations had a moderate effect size and one combination had a large effect size. The \(\beta_3\text{X}G\) values in Table 3.50 indicate which group was favored at lower and higher numbers of linkage levels mastered. A total of 11 combinations favored the focal group at higher numbers of total linkage levels mastered and the reference group at lower numbers of total linkage levels mastered.
| Item ID | Focal | Grade | EE | \(\chi^2\) | \(p\)-value | \(\beta_2G\) | \(\beta_3\text{X}G\) | \(R^2\) | Z&T* | J&G* | Window |
|---|---|---|---|---|---|---|---|---|---|---|---|
| English language arts | |||||||||||
| 14820 | Female | 4 | ELA.EE.RL.4.5 | 16.75 | < .001 | 2.56 | −0.18 | .039 | A | B | Fall |
| 38986 | Female | 6 | ELA.EE.RI.6.1 | 18.33 | < .001 | 0.78 | −0.29 | .048 | A | B | Fall |
| 38989 | Female | 6 | ELA.EE.RI.6.1 | 33.86 | < .001 | 1.19 | −0.38 | .090 | A | C | Fall |
| 44818 | Female | 6 | ELA.EE.RL.6.6 | 9.70 | .008 | −1.09 | 0.16 | .037 | A | B | Fall |
| 37622 | African American | 6 | ELA.EE.RL.6.5 | 23.45 | < .001 | 0.97 | −0.19 | .042 | A | B | Fall |
| 33860 | Female | 7 | ELA.EE.RL.7.5 | 10.39 | .006 | −0.75 | 0.05 | .052 | A | B | Fall |
| 56991 | Female | 8 | ELA.EE.RI.8.5 | 8.10 | .017 | 1.91 | −0.07 | .036 | A | B | Spring |
| 49280 | African American | 8 | ELA.EE.RL.8.2 | 17.62 | < .001 | −4.01 | 0.14 | .045 | A | B | Fall |
| 34775 | Female | 11–12 | ELA.EE.RL.11-12.4 | 9.74 | .008 | −1.12 | 0.10 | .035 | A | B | Spring |
| 37562 | Female | 11–12 | ELA.EE.RI.11-12.3 | 22.07 | < .001 | −1.91 | 0.04 | .037 | A | B | Spring |
| 55590 | Female | 11–12 | ELA.EE.RL.11-12.2 | 20.55 | < .001 | −1.02 | 0.32 | .052 | A | B | Fall |
| Mathematics | |||||||||||
| 36498 | Female | 5 | M.EE.5.MD.1.c | 22.04 | < .001 | −0.78 | 0.35 | .040 | A | B | Fall |
| 8502 | Female | 6 | M.EE.6.RP.1 | 11.91 | .003 | −1.46 | 0.04 | .041 | A | B | Spring |
| 37072 | Female | 7 | M.EE.7.SP.3 | 14.84 | < .001 | −1.29 | 0.04 | .048 | A | B | Spring |
| 11704 | Female | 8 | M.EE.8.G.4 | 8.40 | .015 | 1.14 | −0.13 | .036 | A | B | Spring |
| 41665 | Female | 9 | M.EE.HS.N.CN.2.a | 11.07 | .004 | −2.00 | 0.09 | .037 | A | B | Fall |
| 41683 | Female | 9 | M.EE.HS.N.CN.2.a | 13.33 | .001 | −2.22 | 0.11 | .049 | A | B | Fall |
| Note. EE = Essential Element; Z&T = Zumbo & Thomas; J&G = Jodoin & Gierl; ELA = English language arts; IE = instructionally embedded window. | |||||||||||
| * Effect-size measure. | |||||||||||
3.7 Conclusion
Content in the DLM assessments undergoes multiple rounds of internal and external review before it is promoted into the operational pool. Item writers are trained and given resource materials prior to developing items and testlets. The created content is first reviewed internally by the test development team, the editing team, and content and accessibility panelists. The created content is then reviewed externally by content, accessibility, and bias and sensitivity panelists, and the test development team uses the panelist feedback to revise the items as necessary. After these internal and external reviews are complete, the content is field tested and the results of the field test are reviewed by the test development and psychometric teams. Testlets and items that do not require revision can be promoted to the operational pool.
During the 2021–2022 academic year, the test development teams conducted virtual events for both item writing and external review. Overall, 427 testlets were written for ELA and mathematics. Following external review, the test development team retained 100% and 47% of ELA and mathematics testlets, respectively. Of the content already in the operational pool, most items had p-values within two standard deviations of the mean for the EE and linkage level. Field testing in 2021–2022 focused on collecting data to refresh the operational pool of testlets.