2 Content Structures
This chapter describes the key assessment structures that support the Dynamic Learning Maps® (DLM®) Alternate Assessment System’s purpose and program goals.
The DLM System is based on large, fine-grained learning maps. These learning maps are highly connected representations of the pathways for how academic content is acquired, as reflected in research literature. The DLM maps consist of nodes that represent discrete knowledge, skills, and understandings in either English language arts (ELA) or mathematics, as well as important cognitive skills that support the acquisition of the learning targets associated with grade-level content standards. Connections between nodes represent the development of the knowledge, skills, and understandings. With approximately 1,900 nodes in the ELA map, 2,400 nodes in the mathematics map, and 150 foundational nodes Foundational nodes represent basic skills that are required across subjects and are important precursors to developing competency in learning targets associated with grade-level academic standards. that are associated with both subjects, the DLM learning maps go beyond traditional learning progressions to include multiple pathways by which students with the most significant cognitive disabilities may acquire the academic content.
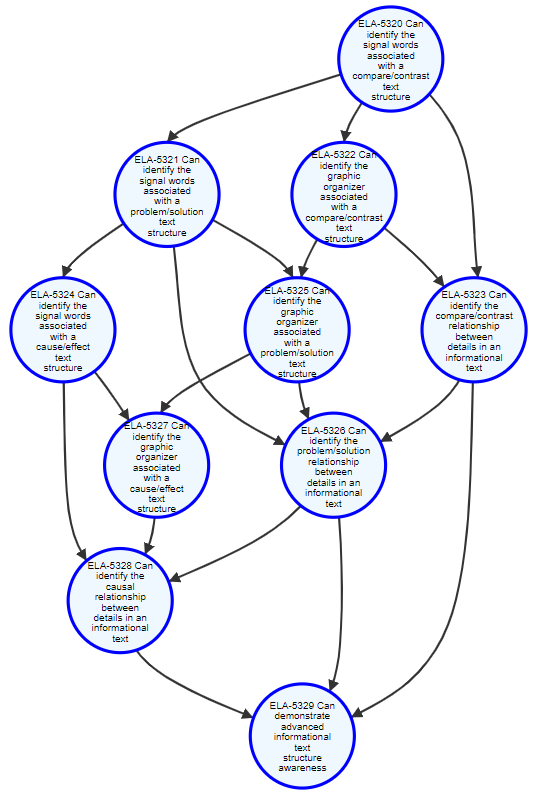
Seen in its entirety, the DLM learning maps are highly complex. A closer look at smaller sections of the DLM learning maps reveals how the discrete nodes are described and connected. Figure 2.1 provides an illustration of a small segment of the DLM ELA learning map. The learning maps are read from the top down, moving from the least to most complex knowledge, skills, and understandings.
Figure 2.1: Sample Excerpt From the DLM English Language Arts Learning Map
Extensive, detailed work was necessary to establish and refine the DLM learning maps in light of the Common Core State Standards (CCSS, National Governors Association Center for Best Practices and Council of Chief State School Officers, 2010) and the needs of the student population. Guided by in-depth reviews of literature and research, as well as extensive input from experts and practitioners, the DLM learning maps are the conceptual and content basis for the DLM System.
This chapter begins a description of the Essential Elements (EEs), which are the learning targets for the DLM assessments. We also describe the development process for the EEs. Then we describe the development process of the DLM learning maps and how they were linked to the EEs. The EEs and the learning maps were developed concurrently, but separately, and then integrated. We then explore how the learning map is organized into claims and conceptual areas and describe the evaluation of the learning map structure. The chapter then describes the development of the DLM assessment blueprints defining EEs for assessment by grade and subject. Finally, the chapter concludes with a description of an external alignment study.
2.1 Essential Elements
EEs are specific statements of knowledge, skills, and understandings in a subject. The purpose of the EEs is to build a bridge from grade-level college and career readiness content standards to academic expectations for students with the most significant cognitive disabilities for both instruction and assessment. They are based on the grade-level general education content standards but are at reduced complexity, linking the grade-level general education content standards to academic expectations that are at an appropriate level of challenge for students with the most significant cognitive disabilities. In other words, EEs are the alternate content standards of the grade-level college and career readiness content standards used in general education assessments.
The progression of grade-level EEs across years of instruction reflects the changing priorities for instruction and learning as students move from grade to grade. The differences between EEs at different grade levels are subtler than what is typically seen in content standards for general education; the grade-to-grade differences in the EEs may consist of added knowledge, skills, and understandings that are not of obvious increasing rigor compared to the grade-to-grade differences found in the general education content standards. However, to the degree possible, the knowledge, skills, and understandings represented by the EEs increase in complexity across the grades, with clear links to the shifting emphases at each grade level in the general education content standards.
An example of three related EEs from the CCSS ELA “Key Ideas and Details” strand is shown in Table 2.1. The content shown is from elementary (Grade 3), middle (Grade 7), and high school (Grades 9–10). There is an increase in what students are asked to do as grade levels increase. Tested EEs for each grade are available on the DLM website for ELA and mathematics.
| Essential Element | Grade | Essential Element Description |
|---|---|---|
| ELA.EE.RI.3.2 | Grade 3 | Identify details in a text. |
| ELA.EE.RI.7.2 | Grade 7 | Determine two or more central ideas in a text. |
| ELA.EE.RI.9-10.2 | Grades 9–10 | Determine the central idea of the text and select details to support it. |
The EEs specify grade-level learning targets, and the DLM learning maps clarify how students can reach those learning targets. For each EE, critical junctures on the path toward the EE’s learning target(s) are identified by one or more nodes in the DLM learning maps. Nodes are also identified past the EE’s learning target(s) to give students an opportunity to grow toward the learning targets of grade-level general education content standards.
These critical junctures of one or more related nodes are called linkage levels. The Target linkage level aligns to the EE’s grade-level learning target(s). There are three linkage levels below the Target (i.e., Initial Precursor, Distal Precursor, and Proximal Precursor) and one linkage level beyond the Target (i.e., Successor). Table 2.2 shows the increasing complexity from linkage level to linkage level for the same EEs shown in Table 2.1. This example provides an illustration of how complexity increases both across linkage levels and across grade levels. The linkage levels are the unit of assessment for the DLM System.
| Linkage level | ELA.EE.RI.3.2 | ELA.EE.RI.7.2 | ELA.EE.RI.9-10.2 |
|---|---|---|---|
| Initial Precursor | The student can demonstrate an understanding that absent objects still exist despite not being visible by searching for objects that are hidden or not visible. | When provided with a picture of an object, or other symbolic representation of that object, the student can correctly match the picture with the real object. | The student can identify concrete details, such as individuals, events, or ideas, in a familiar informational text. |
| Distal Precursor | When provided with language cues, the student can pay attention to the entire object, a characteristic of the object, or an action the object can perform. | After hearing or reading a beginner-level informational text, the student can identify a concrete detail in the text. | After reading or hearing an informational text, the student can identify the topic of the text and textual details that are related to the topic. |
| Proximal Precursor | When provided with illustrations that are related and unrelated to a familiar text, the student can identify the illustrations that relate to aspects of the familiar text, such as people, places, things, and ideas. | After hearing or reading an informational text, the student can identify the implicit main idea of the text and identify the relationships between concrete details. | After reading or hearing an informational text, the student is able to summarize the information from the text. |
| Target | After hearing or reading a beginner-level informational text, the student can identify a concrete detail in the text. | After reading or hearing an informational text, the student can identify more than one main idea in the text. | After reading or hearing an informational text, the student can identify the central idea of the text and the details that contribute to the understanding of the central idea. |
| Successor | After hearing or reading an informational text, the student can identify explicit details that are key to the information in the text. | After reading or hearing an informational text, the student can demonstrate an understanding of the summary of the text by identifying an accurate summary or expressing the main ideas of the text. | The student can identify both the implicit and explicit meaning of an informational text by identifying specific details and citations within the text that support the meaning. |
2.2 Development of the Essential Elements
As previously mentioned, the EEs and the learning maps were developed concurrently, but separately. The development of the EEs involved DLM project staff; Edvantia, Inc., a DLM subcontractor; the DLM Governance Board; and content experts and educators of students with significant cognitive disabilities who were recruited by the DLM Governance Board. Initial planning meetings were held February 2011 to ensure that governance board members were in agreement with the process designed by Edvantia and the goals of the EEs. At the initial meeting and throughout the development process, stakeholders and DLM staff prioritized EEs that increased in complexity across grades and reflected high academic expectations aligned to college and career readiness standards for students with significant cognitive disabilities.
Stakeholder meetings were held via webinar in March 2011 to prepare materials for development meetings. A series of subject-specific webinars were conducted in April 2011 to train panelists before meeting face-to-face to draft the EEs in ELA and mathematics in April–May 2011.
Led by Edvantia, representatives from each of the then DLM partner state education agencies (SEAs) and the selected educators and content specialists developed the original draft of the DLM EEs. The first meeting was held in Kansas City, Missouri, in April 2011, to draft the ELA EEs from kindergarten through twelfth grade. More than 70 participants participated, representing 12 of the 13 states that were working to develop the DLM assessments at that time. A similar meeting was held to draft the mathematics EEs in May 2011, with more than 70 participants representing all 13 member states.
Drafts of the EEs developed at the meetings were compiled and released to participants for review and feedback. Panelists and other stakeholders took part in webinars from July through October 2011 to review drafts. The last drafts were reviewed by SEA and content experts in November 2011. The finalized version was released for state approval in February 2012 and, when approved, was released online in March 2012.
Additional revisions to the EEs were made during the concurrent development of the learning maps, as described in section 2.3.5. Final documents are available publicly on the DLM website for ELA and mathematics.
2.3 Development of the Learning Maps
Learning maps are a type of cognitive model composed of multiple interconnected learning targets and other critical knowledge, skills, and understandings supporting student learning. The development of the DLM assessment system’s learning maps began with a review of the existing literature on learning progressions, a widely accepted and similar approach to assessing student progress over time (Confrey et al., 2014, 2017; Shepard, 2018). Learning progressions depict student learning of the critical concepts related to a topic and depicted in grade-level content standards (Bechard et al., 2012) through multiple, sequenced building blocks that precede and support their mastery (Hess, 2012; Popham, 2011). These building blocks increase in complexity over time and provide different intermediary goals that students may target toward acquiring the learning targets (Bechard et al., 2012). Formative assessments often draw on learning progressions to assist educators in understanding the gap between current student performance and a learning target. Despite these benefits, learning progressions often represent only one individual, straightforward pathway depicting how the average general education student commonly learns the content.
Due to this feature, learning progressions may have difficulties in representing the learning of students with the most significant cognitive disabilities (Hess, 2012; Kearns et al., 2011). The singular and linear pathway of these learning progressions toward a grade-level content standard cannot accurately and sufficiently represent the complexity and diversity in the learning among all of these students (e.g., acquiring writing skills with limited mobility or learning to read with hearing impairments). Students with the most significant cognitive disabilities have a range of sensory differences that may require demonstrating their knowledge, skills, and understandings in different ways than those represented in learning progressions for students who do not use assistive technology.
DLM maps expanded on existing notions of learning progressions by accounting for the multiple pathways students may use to acquire the same learning targets. They also depict the hypothesized connections and interactions described in the research literature between conceptually related content standards within and across topics and grade levels. These changes formed the learning maps guiding the development of the DLM assessment. The resulting maps represent a web-like network of connected learning targets and the critical knowledge, skills, and understandings supporting them (Bechard et al., 2012). The supporting knowledge, skills, and understandings can depict intermediary learning targets advancing students toward acquiring individual content standards. To complement the progression of grade-level learning targets, the DLM learning maps also include the early cognitive skills developing between birth and school entry that form the basis for all subsequent content learning. Finally, the multiple pathways through the DLM learning maps provide accessibility for students with the most significant cognitive disabilities to the learning targets and the critical supporting knowledge, skills, and understandings (Erickson & Karvonen, 2014).
Project staff developed the DLM learning maps in ELA and mathematics, both of which begin with a common set of basic cognitive skills that provide a basis for academic skill development. The project staff consisted of individuals with expertise in cognitive psychology, literacy, and mathematics, as well as individuals with experience with students with significant cognitive disabilities, among other areas. To create these interconnected DLM learning maps, map developers followed a four-step process.
- Identification and representation of learning targets
- Identification and representation of critical supporting knowledge, skills, and understandings
- Development of connections between nodes and building accessible pathways
- Linking the learning maps to the EEs
In each step, the synthesized literature review informed development activities, which were followed by rounds of internal review to ensure the learning maps were consistent with the guidelines outlined within each step. These four steps are described in the subsequent sections.
2.3.1 Identification and Representation of Learning Targets
The first step in the development of the DLM learning maps was to identify learning targets. The DLM learning maps consist of two basic elements: nodes and connections. The nodes are essential, unique, observable, and testable knowledge, skills, and understandings. Nodes can either directly represent learning targets or may represent the critical knowledge, skills, and understandings supporting the acquisition of the learning targets. The second element, connections, forms the relationship between nodes.
Because the DLM assessments measure student achievement of the alternate grade-level expectations—the EEs, aligned to college and career-readiness content standards—the CCSS served as a starting place for node development. Specifically, grade-level CCSS became individual nodes within the DLM learning maps. The CCSS were initially used in early map development. The EEs were later integrated into the DLM learning maps as an additional set of learning targets that largely preceded the CCSS learning targets.
During initial map development, when a content standard contained multiple knowledge, skills, and understandings unsuitable to be combined into a single node, these different knowledge, skills, and understandings were represented as distinct nodes in the DLM learning maps. These nodes representing the grade-level learning targets are called learning target nodes. Once the learning target nodes had been created, they were arranged in the DLM learning maps according to grade-level(s).
2.3.2 Identification and Representation of Critical Supporting Knowledge, Skills, and Understandings
After identifying the learning targets, the next step in the development of the DLM learning maps focused on identifying and representing the critical knowledge, skills, and understandings supporting the acquisition of the learning targets and filling the gaps between the learning target nodes in the DLM learning maps.
The nodes representing these critical supporting knowledge, skills, and understandings are called supporting nodes. The results from a systematic literature review provided the primary input for creating these supporting nodes. Given that the CCSS for kindergarten begins at a relatively complex cognitive and language level, the map developers employed a bottom-up approach in the literature search, looking initially for research concerning early cognitive development (e.g., attending to object characteristics due to language cues) and then building toward the more advanced grade-level learning targets (e.g., answering wh-questions about details in a narrative). Wherever possible, the map developers used empirical research to drive the development and sequence of the supporting nodes. Table 2.3 provides an example of the alignment between a research-based learning progression and the supporting nodes based on them.
| Stages of spelling development† | Nodes in the learning map |
|---|---|
| Precommunicative spelling | Spells words by including random letters |
| Semiphonetic spelling | Spells words by partially using letters to represents individual sounds |
| Phonetic spelling | Spells words by using letters to represent individual sounds |
| Transitional spelling | Spells words by using letters based on common letter patterns found in print |
| Conventional spelling | Spells words correctly using knowledge of letter-sound relationships and common spelling patterns |
| † See Gentry (1982) for details. |
This step also involved making hypotheses and logical analyses about potential supporting nodes to fill in sections of the learning maps where the literature review provided no input. The map developers used common instructional practices, other curricular information, and expert judgment to provide ideas for the supporting knowledge, skills, and understandings that complete the gaps between learning target nodes. Regardless of their origin, each supporting node had a succinct name that summarizes the knowledge, skill, or understanding; an extended description that provides additional detail; and an observation that describes a context in which students could demonstrate their learning of the node’s content.
Despite the DLM System’s focus on students with the most significant cognitive disabilities, the empirical literature on the acquisition of academic skills by typical students primarily provided the basis for developing the learning maps in ELA and mathematics. Systematic literature reviews revealed a dearth of research related to academic skill development among students with the most significant cognitive disabilities. As a result, the map developers focused on first building a “super highway” to represent typical development with multiple pathways to learning targets. The map developers then adapted the learning maps by adding any additional pathways specific to students with significant cognitive disabilities as needed.
2.3.2.1 Critical Sources
Node development was based on a systemic literature review of articles, books, and book chapters summarizing the developmental research in a domain area. Book chapters and research syntheses broadly surveying the literature in a given domain were most useful to the map developers in developing the learning maps in ELA and mathematics. The grade-level content standards provided the parameters to guide the literature search. Node development began with the map developers identifying key terms within the content standards and locating relevant research handbooks or edited chapter books. These broad literature reviews were of the greatest utility because they often synthesized research findings into a developmental learning trajectory of the academic skills pertinent to the domain (e.g., Nippold, 2007; Sarama & Clements, 2009). Additionally, the map developers identified individual studies that were considered seminal to a particular domain, which could be used when building supporting nodes for a specific section of the DLM learning maps. If a particular researcher’s empirical work was sought out, the map developers looked for articles summarizing a series of findings into a developmental sequence (often using “acquisition” as a search term). The map developers also identified articles reporting the findings of longitudinal and cross-sectional samples that provide insight into the developmental acquisition of academic skills. When these sources were unavailable or did not cover the entire learning map area, the map developers synthesized the findings from multiple empirical studies to generate appropriate supporting nodes.
2.3.2.2 Nodes Reflect the Products of Learning and Cognitive Advancement
The learning maps depict learning between birth and school entry. The supporting nodes developing between birth and school entry reflect the learning and cognitive growth that occurs during this period by becoming increasingly more complex. For example, early developing cognitive skills, such as seeking the attention of others, provide the basis for more complex and later-developing ones, such as using words to request, comment, and command.
The supporting knowledge, skills, and understandings that develop after school entry provide steps that help students meet grade-level learning targets. Nodes throughout the learning maps reflect increased cognitive skills (e.g., improving logical and analytical thought and increasing declarative, procedural, and metacognitive knowledge), resources (e.g., increasing working memory span and attention), and instruction (e.g., learning basic abstract symbols following exposure and explicit instruction). Figure 2.2 represents an example of the gradually increasing complexity of supporting nodes in the DLM learning maps. These shifts in the knowledge, skills, and understandings depicted in the supporting nodes complete the framework established by the grade-level learning targets.
Figure 2.2: Example Progressions of Supporting Nodes Toward the Target Node
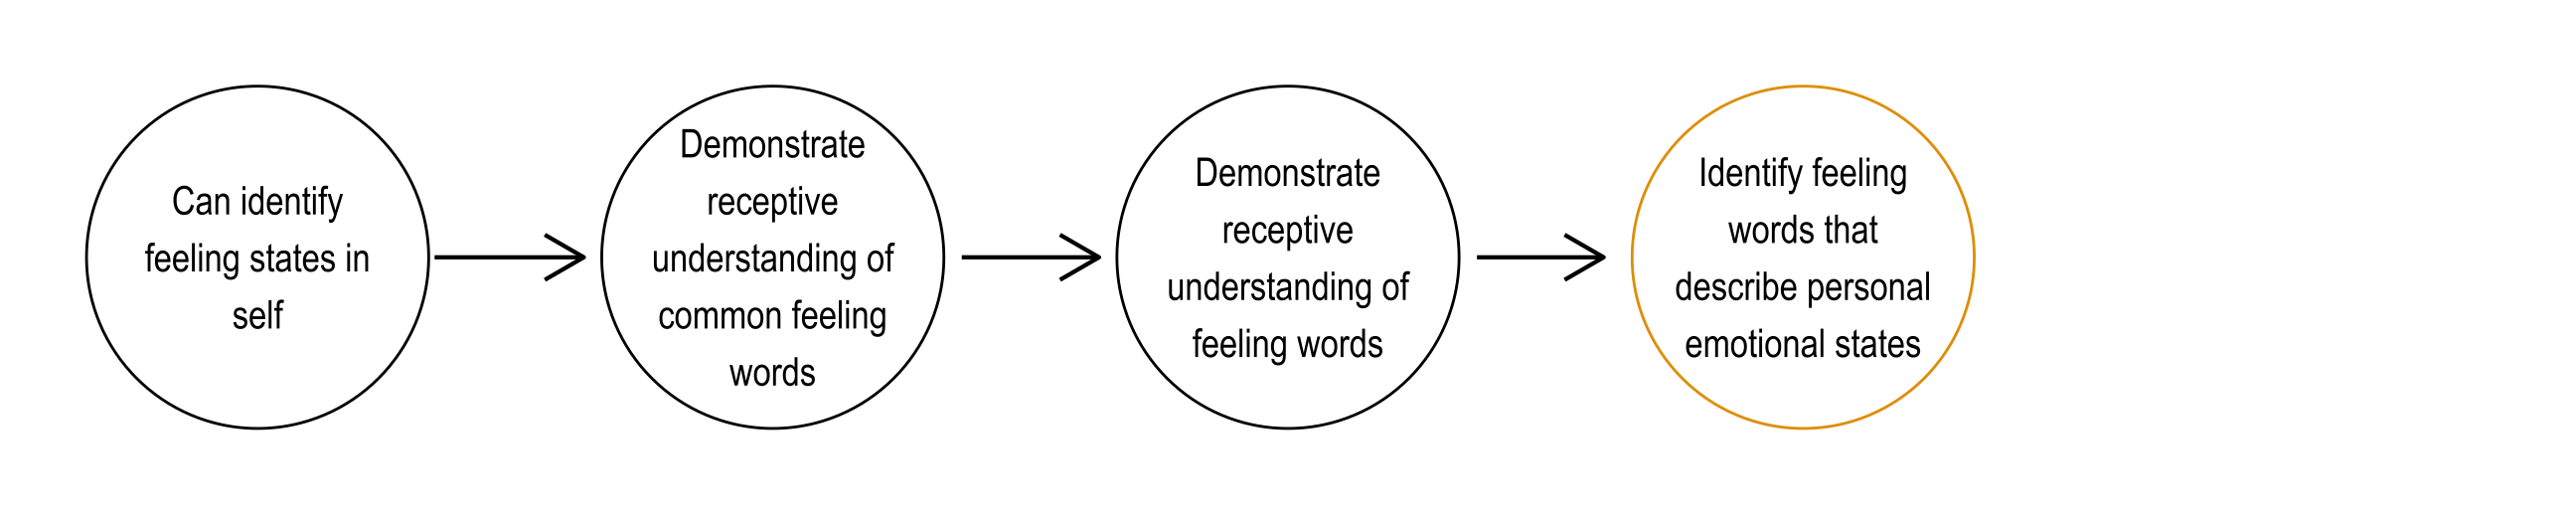
Note. The target node for the Essential Element is the orange circle.
2.3.2.3 Foundational Nodes
Even in the early grades, learning targets associated with grade-level content standards require the application of basic cognitive skills. These basic cognitive skills are required across subjects and include such things as attention, self-regulation, language, and categorization. Foundational nodes represent these basic cognitive skills in ELA and mathematics. Some students with the most significant cognitive disabilities must be taught learning targets associated with foundational nodes to work toward learning targets associated with grade-level content standards (Kleinert et al., 2009).
2.3.2.4 Node Development Criteria
The nodes representing the critical knowledge, skills, and understandings supporting the acquisition of grade-level learning targets met specific criteria before inclusion. These criteria focus on the content and accessibility of the nodes and ensure that the learning maps consisted of only the nodes that were critical to represent student content learning. The criterion were that the node should be (1) essential, (2) unique, (3) appropriately sized, (4) accessible, and (5) observable and measurable. The first criterion for node development was whether the nodes were essential for students to advance toward one or more grade-level learning targets in the DLM learning maps. The results of the systematic literature review and map developer judgment guided the process of determining whether to include the node.
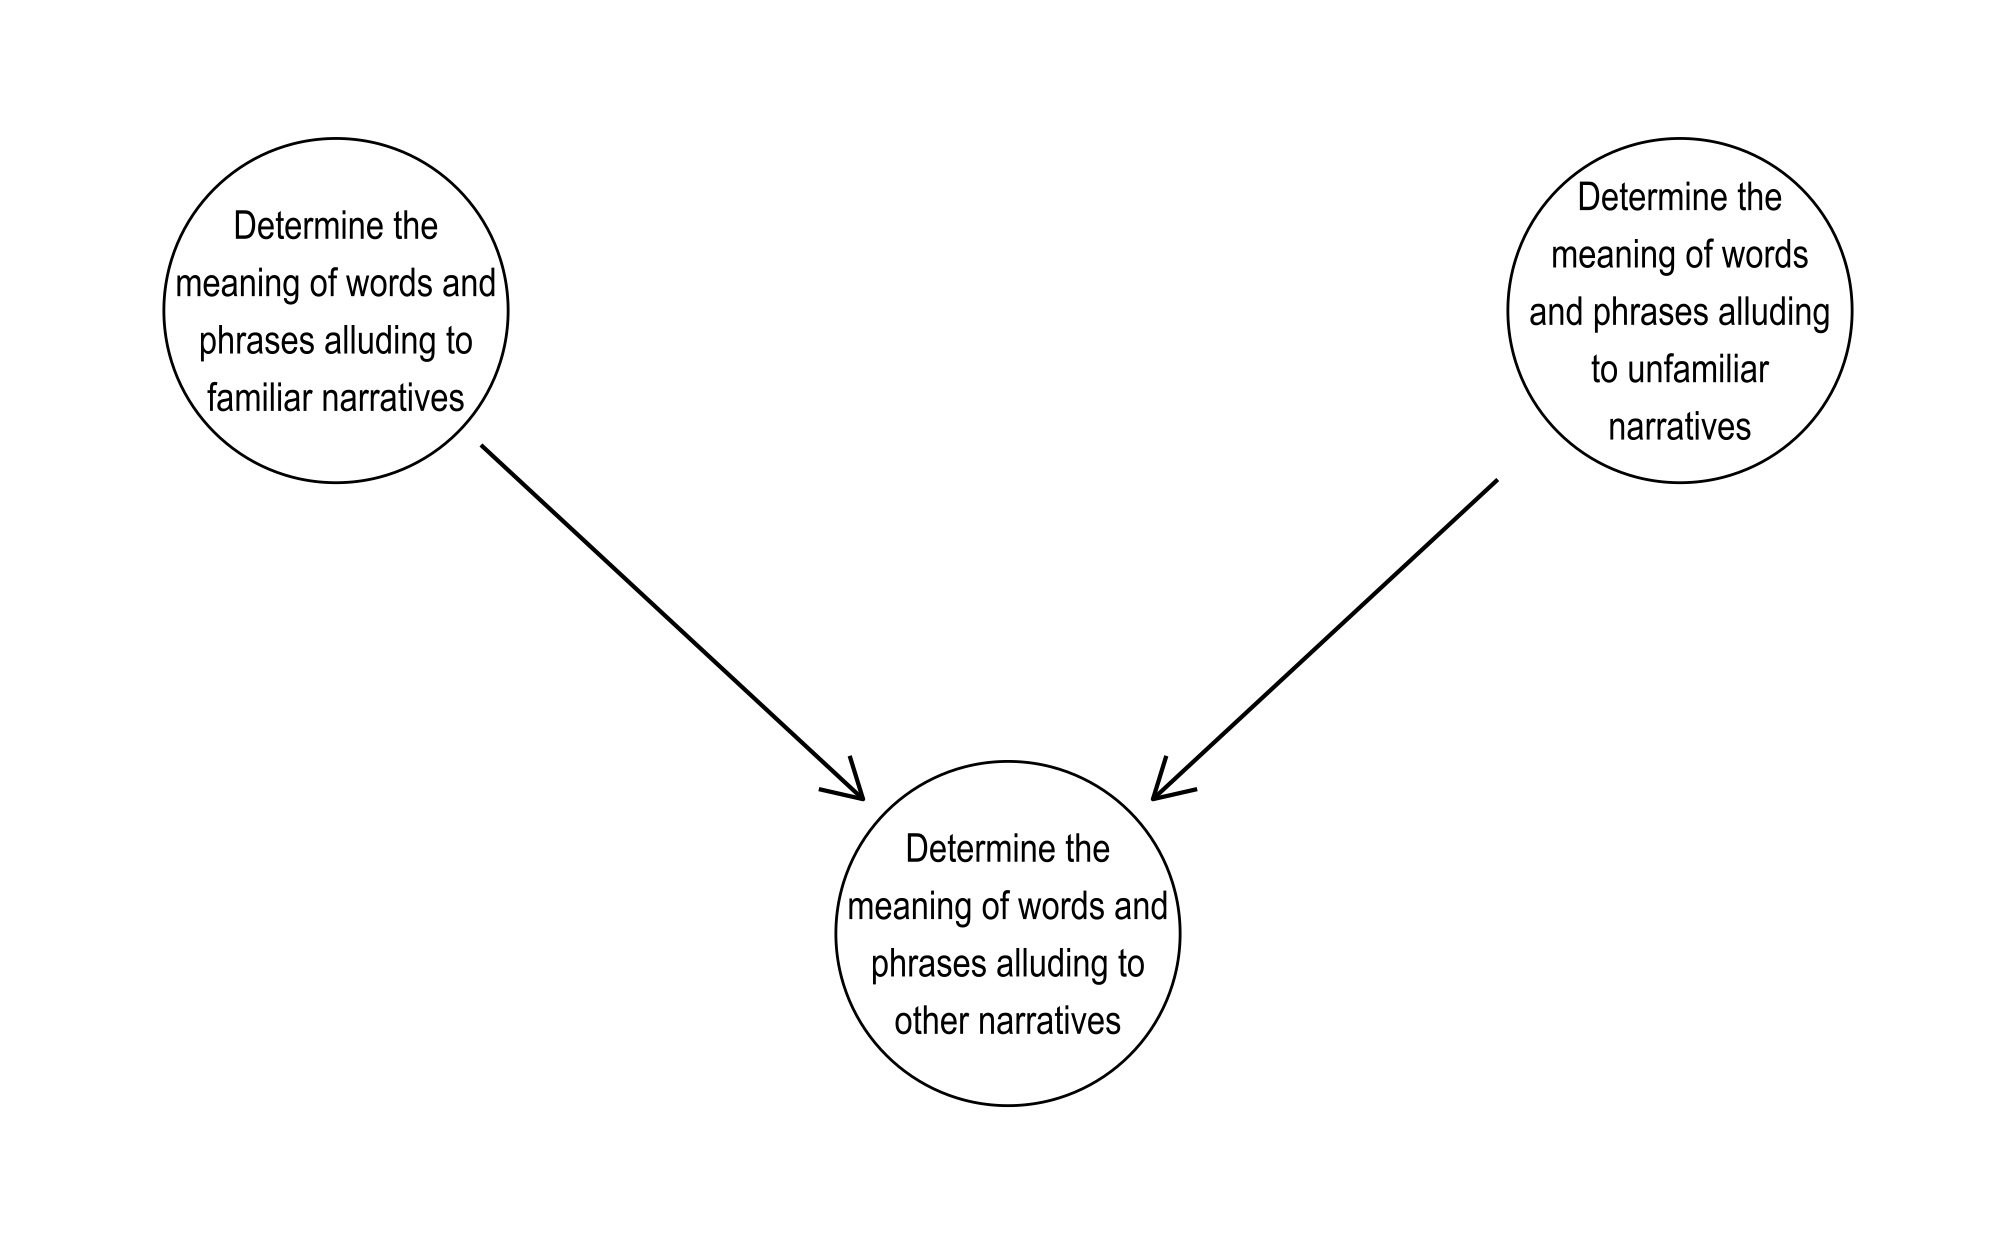
The second criterion of node development required nodes to not duplicate the knowledge, skills, and understandings depicted in the surrounding nodes. In other words, the map developers created nodes distinct from other nodes by extending the knowledge, skills, and understandings covered in the preceding node(s) and contributing to those associated with the succeeding node(s). If a new node was not unique, the map developers combined its content with a current node in the DLM learning maps, as shown in Figure 2.3.
Figure 2.3: Combining Two Indistinct Nodes Into One Combined Node
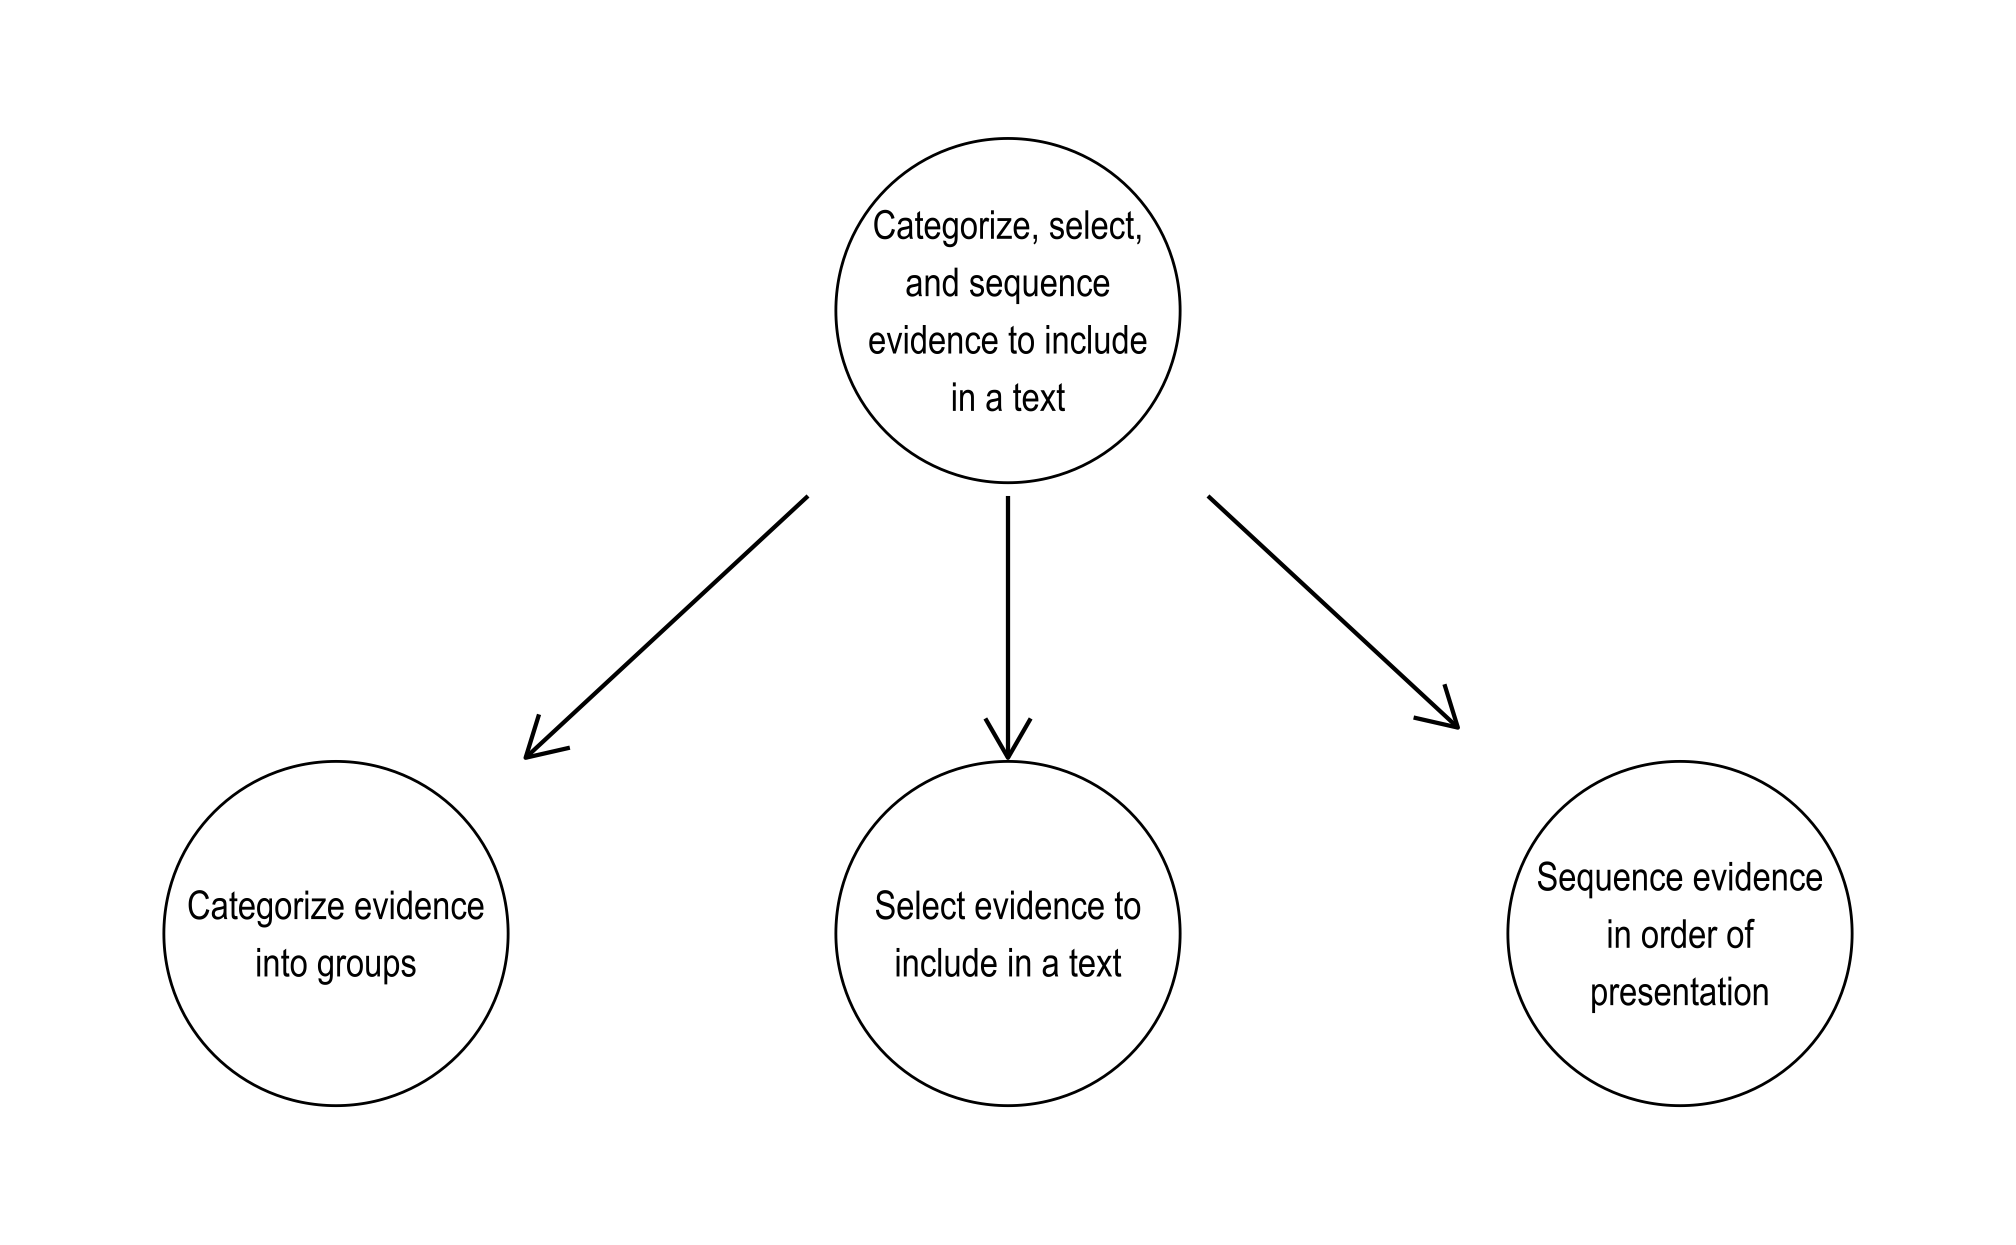
The third criterion was that a node should represent only a single concept or skill in node development. This ensured that a new node was of a similar grain size to the surrounding nodes in the maps. The map developers divided nodes that were too large into multiple, more reasonably sized nodes (see Figure 2.4) or combined nodes that were too small into a single node. The characteristics of students with the most significant cognitive disabilities guided the identification of the appropriate node size.
Figure 2.4: Dividing One Node Into Multiple, Reasonably Sized Nodes
The fourth criterion of node development required the map developers to generate nodes accessible to students with the most significant cognitive disabilities. Accessible nodes reflect the principles of Universal Design for Learning (Center for Applied Special Technology, 2018) and are free of barriers for students with specific sensory, mobility, or communication disabilities. More specifically, they should account for variability among students, increasing the range of access to the node’s content. When provided with the necessary support, all students, regardless of their disability, should have the opportunity to demonstrate their learning. Inaccessible nodes require students to demonstrate their understanding of the node’s content through only one modality or format. The map developers made nodes more accessible by allowing multiple modalities or formats (see Table 2.4).
| Accessible nodes | Nonaccessible nodes |
|---|---|
| Introduce the topic or book being written about and then state an opinion on it when writing an opinion piece | Introduce the topic or book being written about and then state an opinion on it when writing an opinion piece using pencil and paper |
| Sort information related to a topic from print or digital sources into given categories | Sort visual information related to a topic from print or digital sources into given categories |
The final criterion for development was that the nodes were observable and measurable. If nodes are observable and measurable, students should have the opportunity to demonstrate their learning of the node’s content. These nodes require some form of expression that reflects the knowledge, skill, or understanding depicted in the node’s content, allowing educators and test developers to gauge student mastery. Nodes lack observability and measurability when they only occur within the student’s mind or require inferences from other behaviors.
In summary, the learning maps contain only nodes meeting the above requirements, and each node contains critical supporting knowledge, skills, and understandings for the acquisition of the learning targets.
2.3.3 Development of Connections Between Nodes
After the learning target and supporting nodes were identified, they were arranged and connected according to their developmental acquisition, based on the empirical literature or in order of common instructional or curricular practices. An individual connection represents the directionality of the relationship between two nodes—the origin node and the destination node. For inclusion in the DLM learning maps, a connection should be logical, appropriate, and accessible. The map developers built logical origin-to-destination connections that represent increased cognitive progressions, where origin nodes are cognitively less complex than the destination nodes (see Figure 2.5A). Origin nodes precede and are hypothesized to develop before the destination nodes. Connections should not represent an overly large leap in complexity between the origin and destination nodes (see Figure 2.5B). The map developers built accessible origin-to-destination connections that do not contain any barriers limiting the access to the origin and destination nodes’ content for students with the most significant cognitive disabilities (see Figure 2.5C).
Figure 2.5: Examples of Criteria for Making Connections Between Nodes
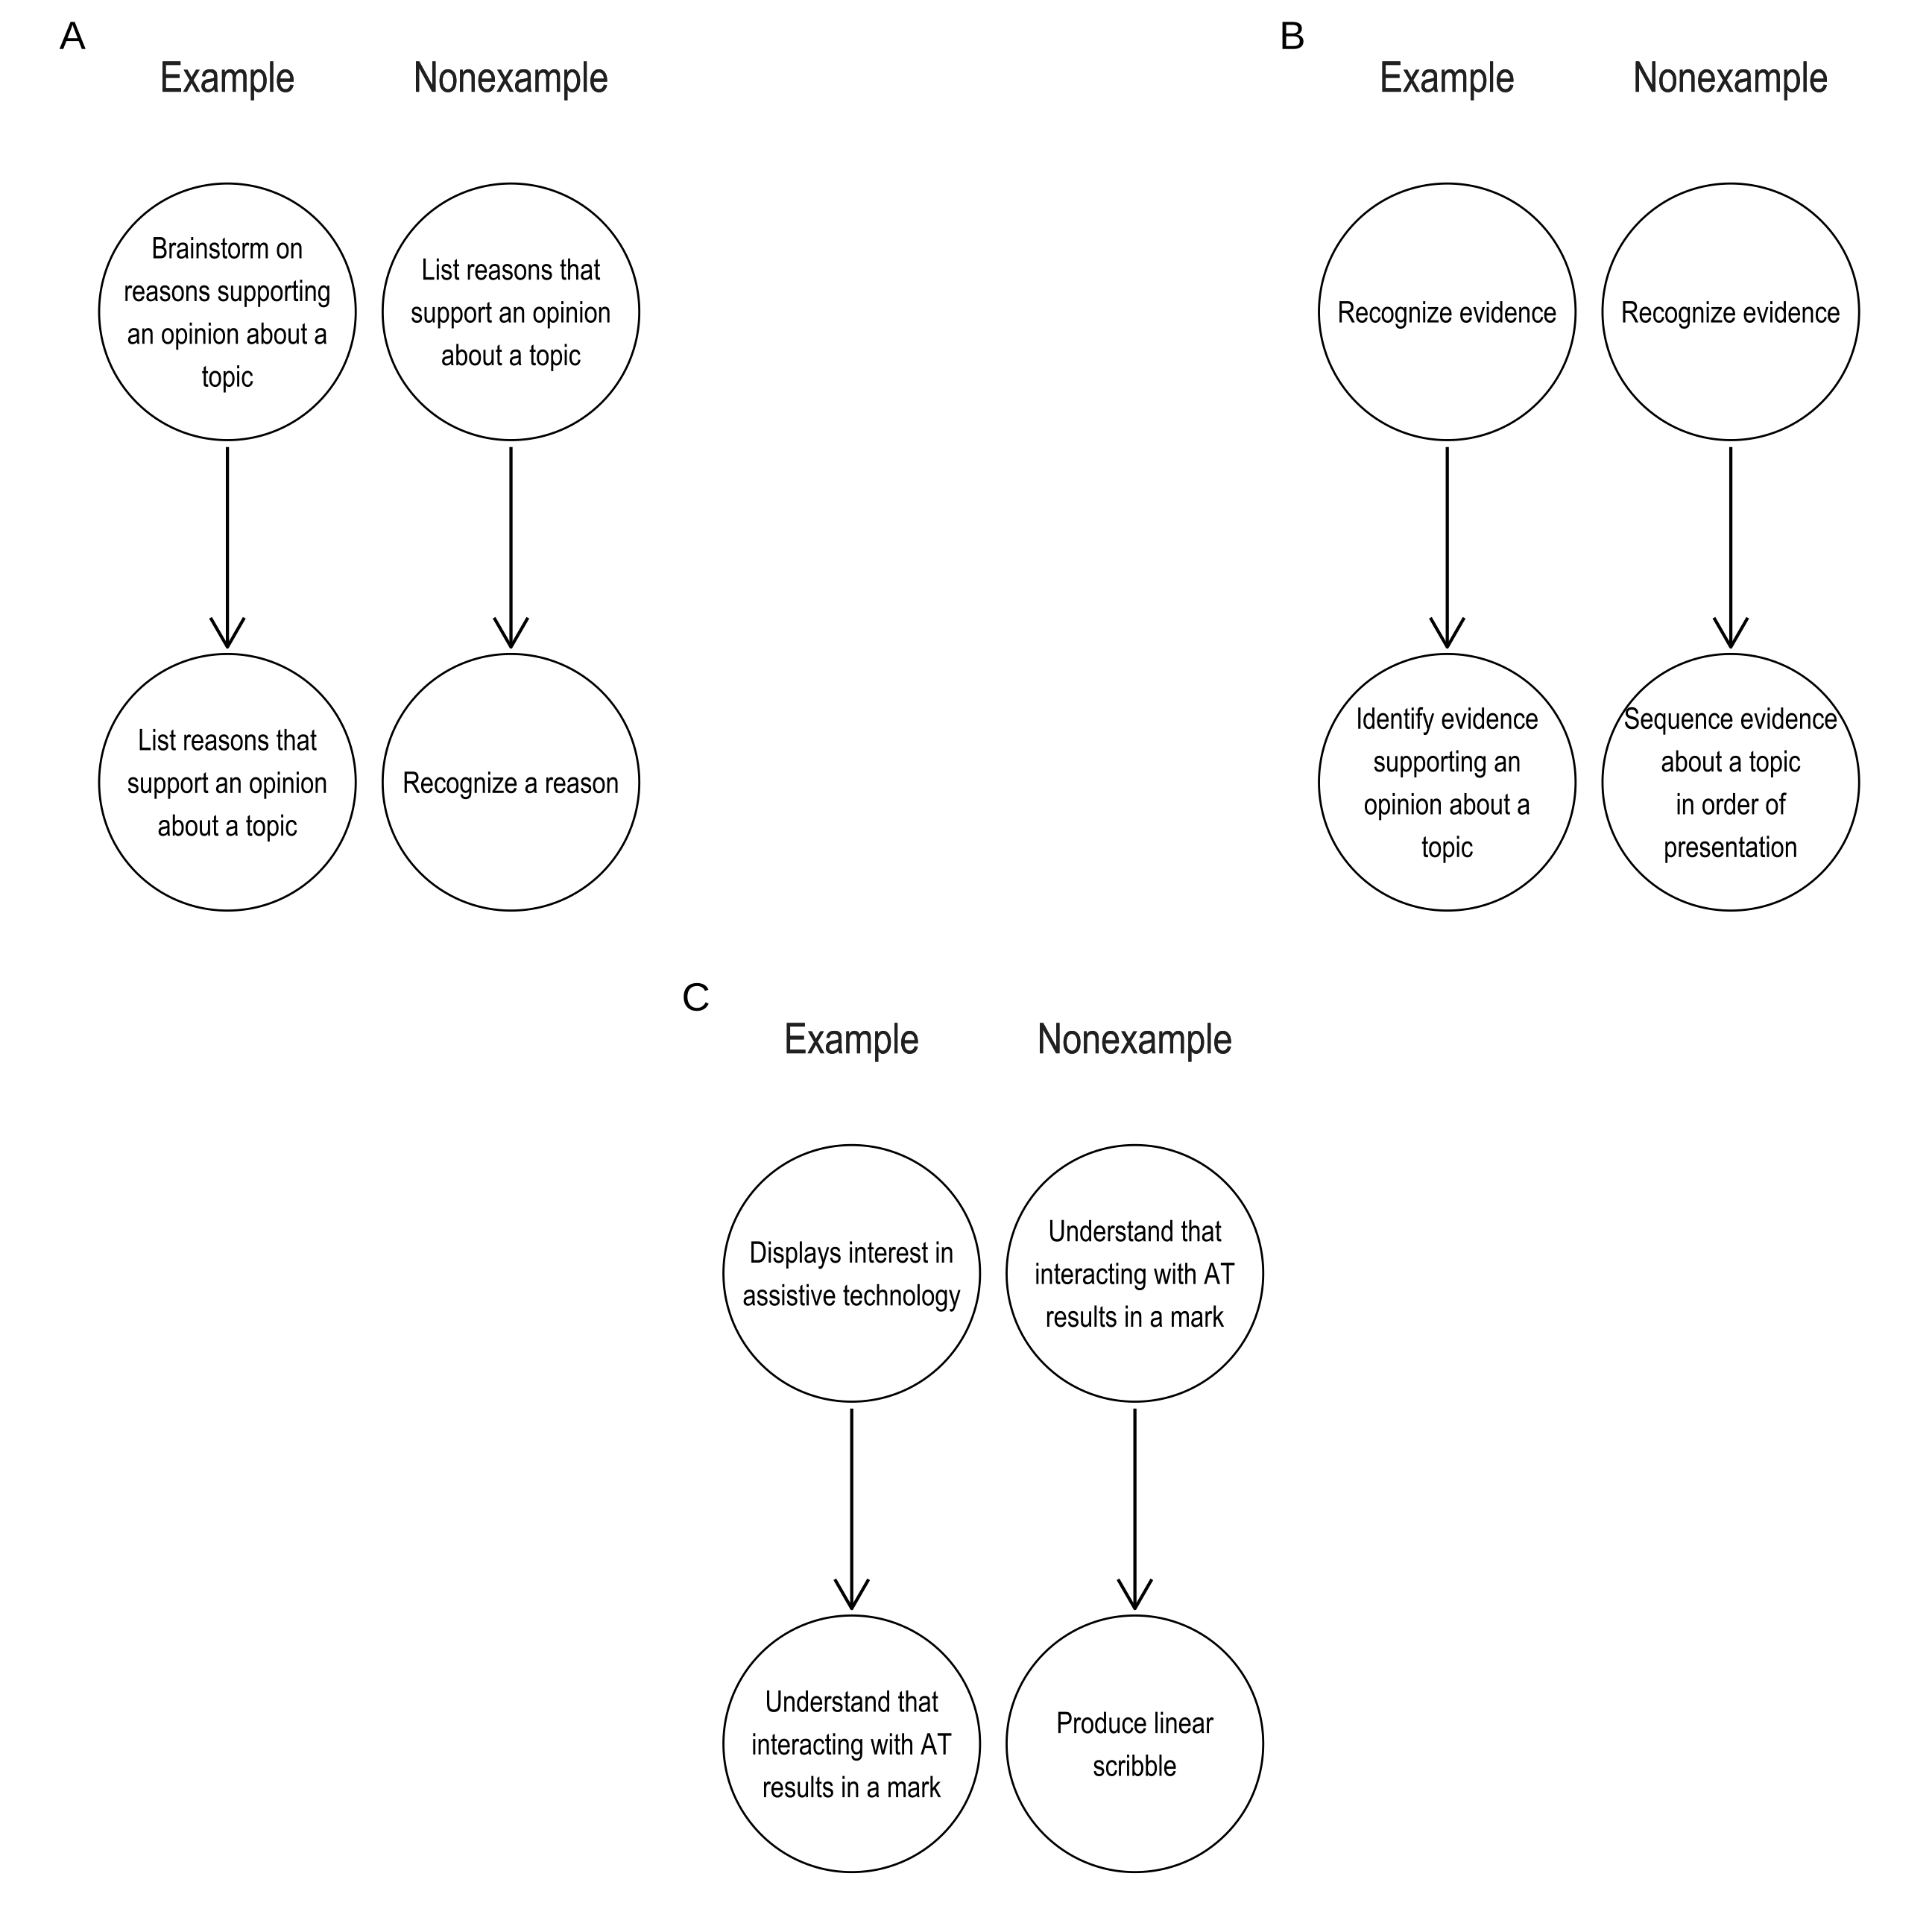
Note. Panel A: Example and Nonexample of a logical connection between two nodes. Panel B: Example and Nonexample of an appropriate connection between two nodes. Panel C: Example and Nonexample of an accessible connection between nodes.
As an example, small sections of the DLM learning map are provided in Figure 2.6 and Figure 2.7. This map section covers the nodes leading up to the spelling of untaught words phonetically. Figure 2.6 illustrates the structure of the DLM learning maps, including multiple pathways, while Figure 2.7 displays the nodes used for assessment. Both figures highlight a specific pathway to demonstrate the interconnected nature of the DLM learning maps. The pathway depicts how a student would progress from one node (i.e., can identify the first letter of their own name) to a later node (i.e., can spell words with inflectional endings). Items used in the DLM assessment system have been created to measure some of the nodes in this pathway, and these nodes have been color-coded to identify their location within the map section.
The colored nodes in both figures represent tested nodes, which are nodes that have been identified as making a significant contribution to the acquisition of the learning target by the map developers and content experts. These nodes typically precede or directly follow the learning target node (e.g., can spell words phonetically using letter-sound knowledge and common spelling patterns), but they are not the only nodes contributing to the acquisition of the learning target, nor do they prescribe the only route that can be taken toward acquiring it.
Figure 2.6: Section of the Learning Map Representing Basic Cognitive and Academic Skills
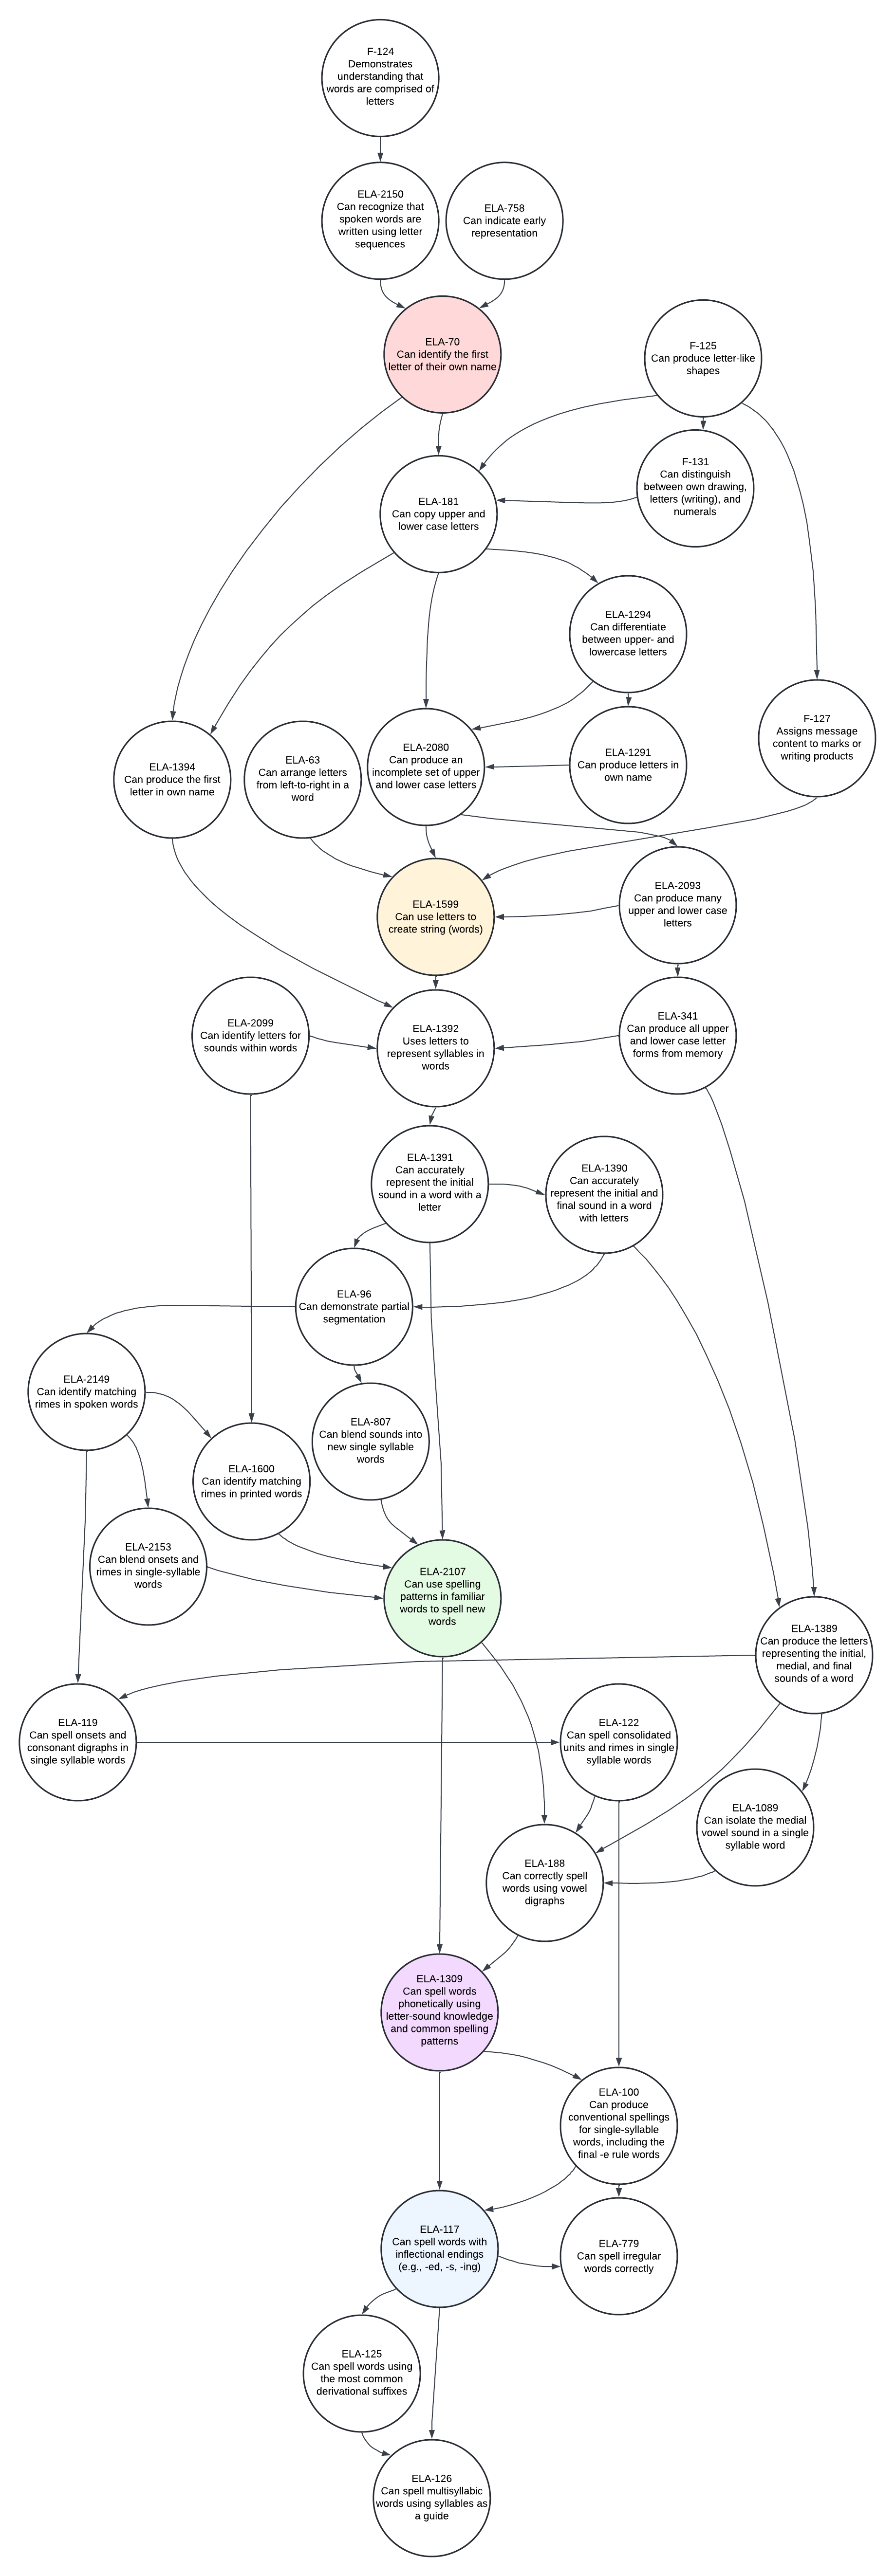
Note. The color-coded nodes in the map section represent a pathway of tested nodes, with the learning target for this Essential Element highlighted in purple.
Figure 2.7: Pathway of Nodes Covering Essential Element ELA.EE.L.6.2.b
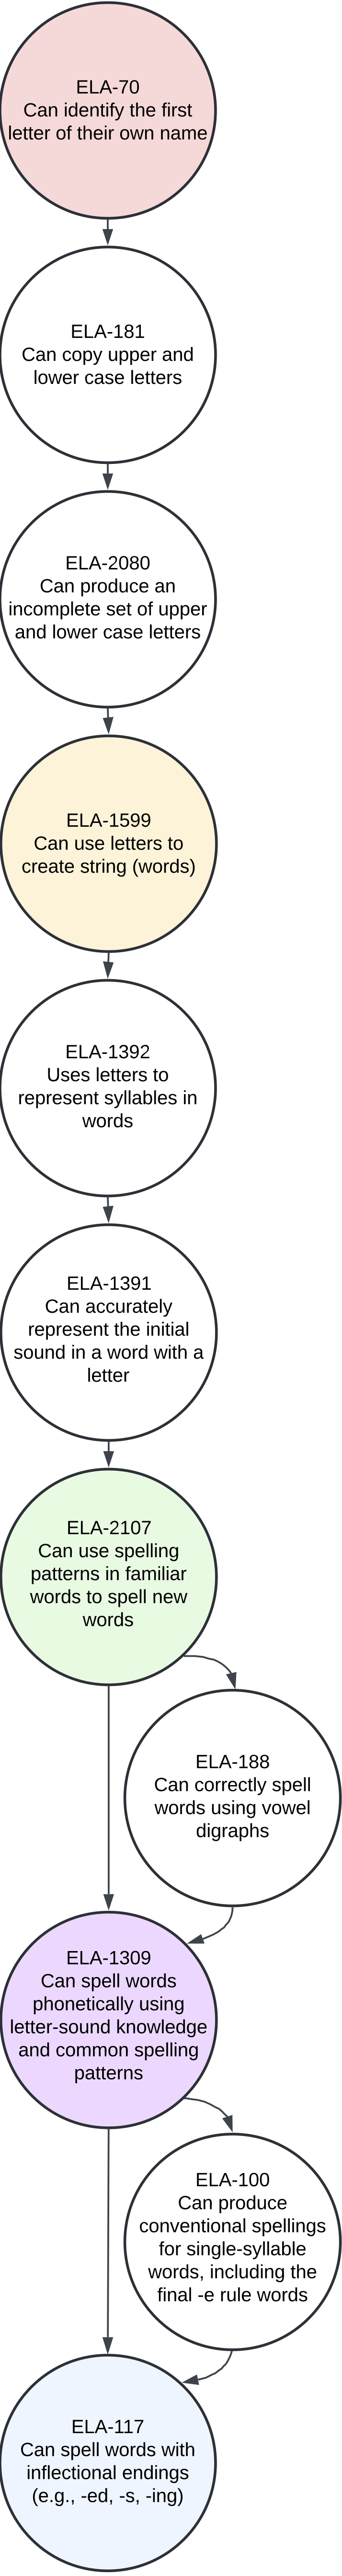
Note. The color-coded nodes in the map section represent a pathway of tested nodes, with the learning target for this Essential Element highlighted in purple.
2.3.4 Accessibility of Nodes and Pathways
Creating appropriate learning targets alone does not sufficiently provide all students with the most significant cognitive disabilities access to the content in the DLM learning maps. Some students exhibit sensory, mobility, or communication disabilities that require different means for representation and action or expression to provide evidence of mastery for some nodes in the DLM learning maps. A critical step in making the DLM learning maps accessible to all students involves verifying that nodes and pathways are appropriate for all students and their sensory, mobility, and communication needs. These pathways allow all students to achieve grade-level learning targets when provided with appropriate support and access to instruction and assessments based on the principles of Universal Design for Learning (Center for Applied Special Technology, 2018).
The map developers, in partnership with the Center for Literacy and Disability Studies (CLDS) at the University of North Carolina, enhanced accessibility of the DLM learning maps for students with specific disabilities. The CLDS team reviewed each node and considered whether the node was accessible to individuals with learning differences across four primary areas: vision, hearing, mobility, and communication. Nodes flagged during this process were most likely inaccessible to students with specific sensory, mobility, or communication disabilities even when considering potential accommodations. For example, many early writing nodes involve skills like scribbling before students can produce letters and numerals. For students with mobility differences, the writing acquisition process will include learning to use assistive technology to select letters and numbers. In this example, an accommodation allowing the students to choose scribbles would be inappropriate. As a result, the CLDS team flagged as inaccessible the early writing nodes related to scribbling because the cognitive process of learning to write involves some fundamental differences for students using assistive technology to communicate. Clusters of these flagged nodes represented a section within the DLM learning maps that posed challenges for students with specific sensory, mobility, or communication disabilities.
For example, in Figure 2.8, students with mobility impairments would demonstrate their writing knowledge and skills in different ways than students who do not use assistive technology. In this example, the learning target may be ELA-1394, “Can produce the first letter in their own name.” The green pathway describes how students who do not use assistive technology might acquire the knowledge and skills for this target (e.g., drawing scribbles, diagonal lines, circles). Conversely, students with mobility impairments may instead acquire the skills to use assistive technology, such as selecting using the technology to select letters first at random and then in a pattern, as shown in the orange pathway. These nodes represent the cognitive steps involved with learning to use writing methods different from those used by students without mobility impairments.
Figure 2.8: Hypothesized Pathways in Writing for Students With and Without Mobility Disabilities
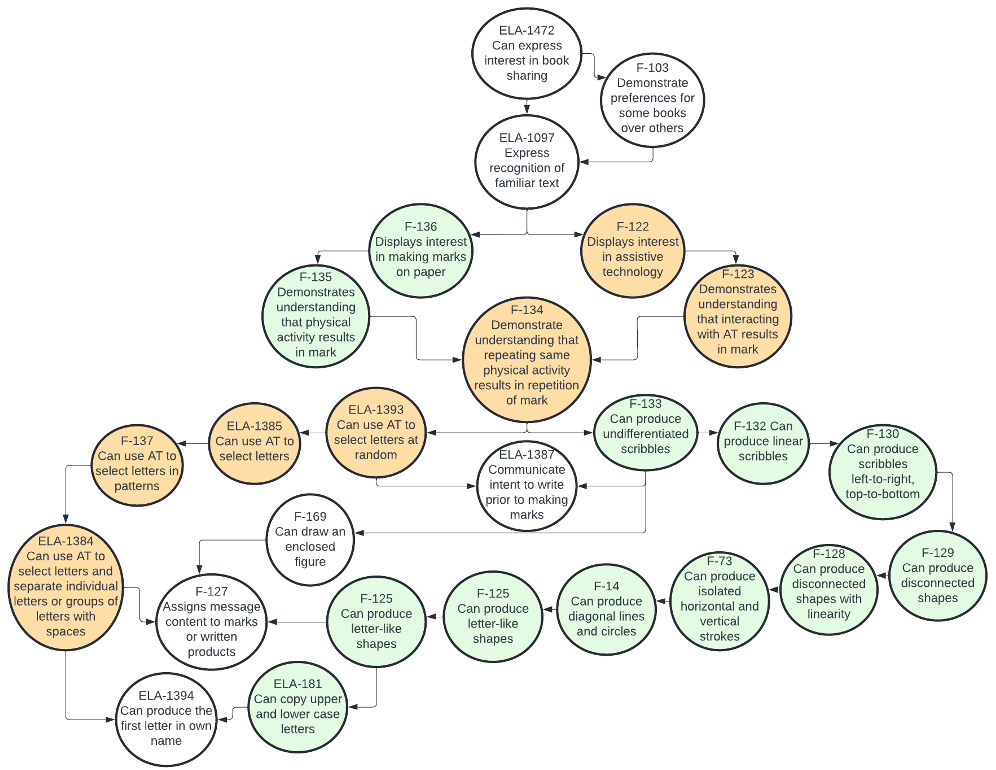
Note. Green shading indicates the writing development of mobility-typical students. Orange shading suggests an accessible path for students with mobility impairments using assistive technology.
2.3.5 Linking the Learning Maps to the Essential Elements
Because the primary goal of DLM assessments is to measure what students with the most significant cognitive disabilities know and can do, EEs were created to reflect more accurately the knowledge, skills, and understandings that are appropriately challenging grade-level learning targets for the students. Within each subject, the EEs were derived from CCSS to represent similar academic skill development sequences as the CCSS.
EEs were first written based on the CCSS, independent of the learning maps development process in 2012 (see section 2.2 for a description of the EE development). At the same time that the EEs were being developed, map developers were actively engaged in building the maps in ELA and mathematics. Because the development of the EEs and the learning maps happened simultaneously, alignment between the EEs and the learning maps was not possible until the fall of 2012. The process of evaluating the alignment between the EEs and the DLM learning maps involved reconciling the content of the EEs to the content represented in the nodes and connections of the DLM learning maps in ELA and mathematics.
Teams of content experts worked together to revise the initial 2012 version of the EEs and the DLM maps to ensure appropriate alignment of these two elements of the assessment system. Alignment involved horizontal alignment of the EEs with the CCSS and vertical alignment of the EEs with meaningful progressions of skills represented by nodes in the DLM maps. The process of aligning the maps and the EEs began by identifying nodes in the maps that represented the EEs in mathematics and ELA. This process revealed areas in the maps where additional nodes were needed to account for incremental increases in expectations across related EEs from one grade to the next. Areas were also identified in which an EE was out of place developmentally with other EEs in the same or adjacent grades according to research that was incorporated into the maps. For example, adjustments were made when an EE related to a higher-grade map node appeared earlier on the map than an EE related to a lower-grade map node (e.g., a fifth-grade skill preceded a third-grade skill). Finally, the alignment process revealed EEs that were actually written as instructional tasks rather than learning outcomes. These EEs were revised to represent knowledge and skills rather than instructional tasks. These revisions were compiled and reviewed by the governance board in early 2013, with an approved final version of the EEs published in May 2013. Final documents are available publicly on the DLM website for ELA and mathematics.
This process of aligning the EEs and learning maps also resulted in significant revisions to the DLM learning maps to ensure that the nodes and connections represented a solid framework from which assessments could be developed. Depending on the complexity of the EE, one or more nodes in the DLM learning maps were aligned to the EE as learning targets. If no existing node(s) corresponded to the content of the EE, new nodes were created and placed in the DLM learning maps at appropriate locations according to their content. New nodes were placed in the DLM learning maps by analyzing the existing map structure to identify precursor and successor nodes to the new node. Once identified, the map developers proposed placements of new nodes and connections based on literature reviews and expert judgment.
2.4 Organizing the Learning Maps: Claims and Conceptual Areas
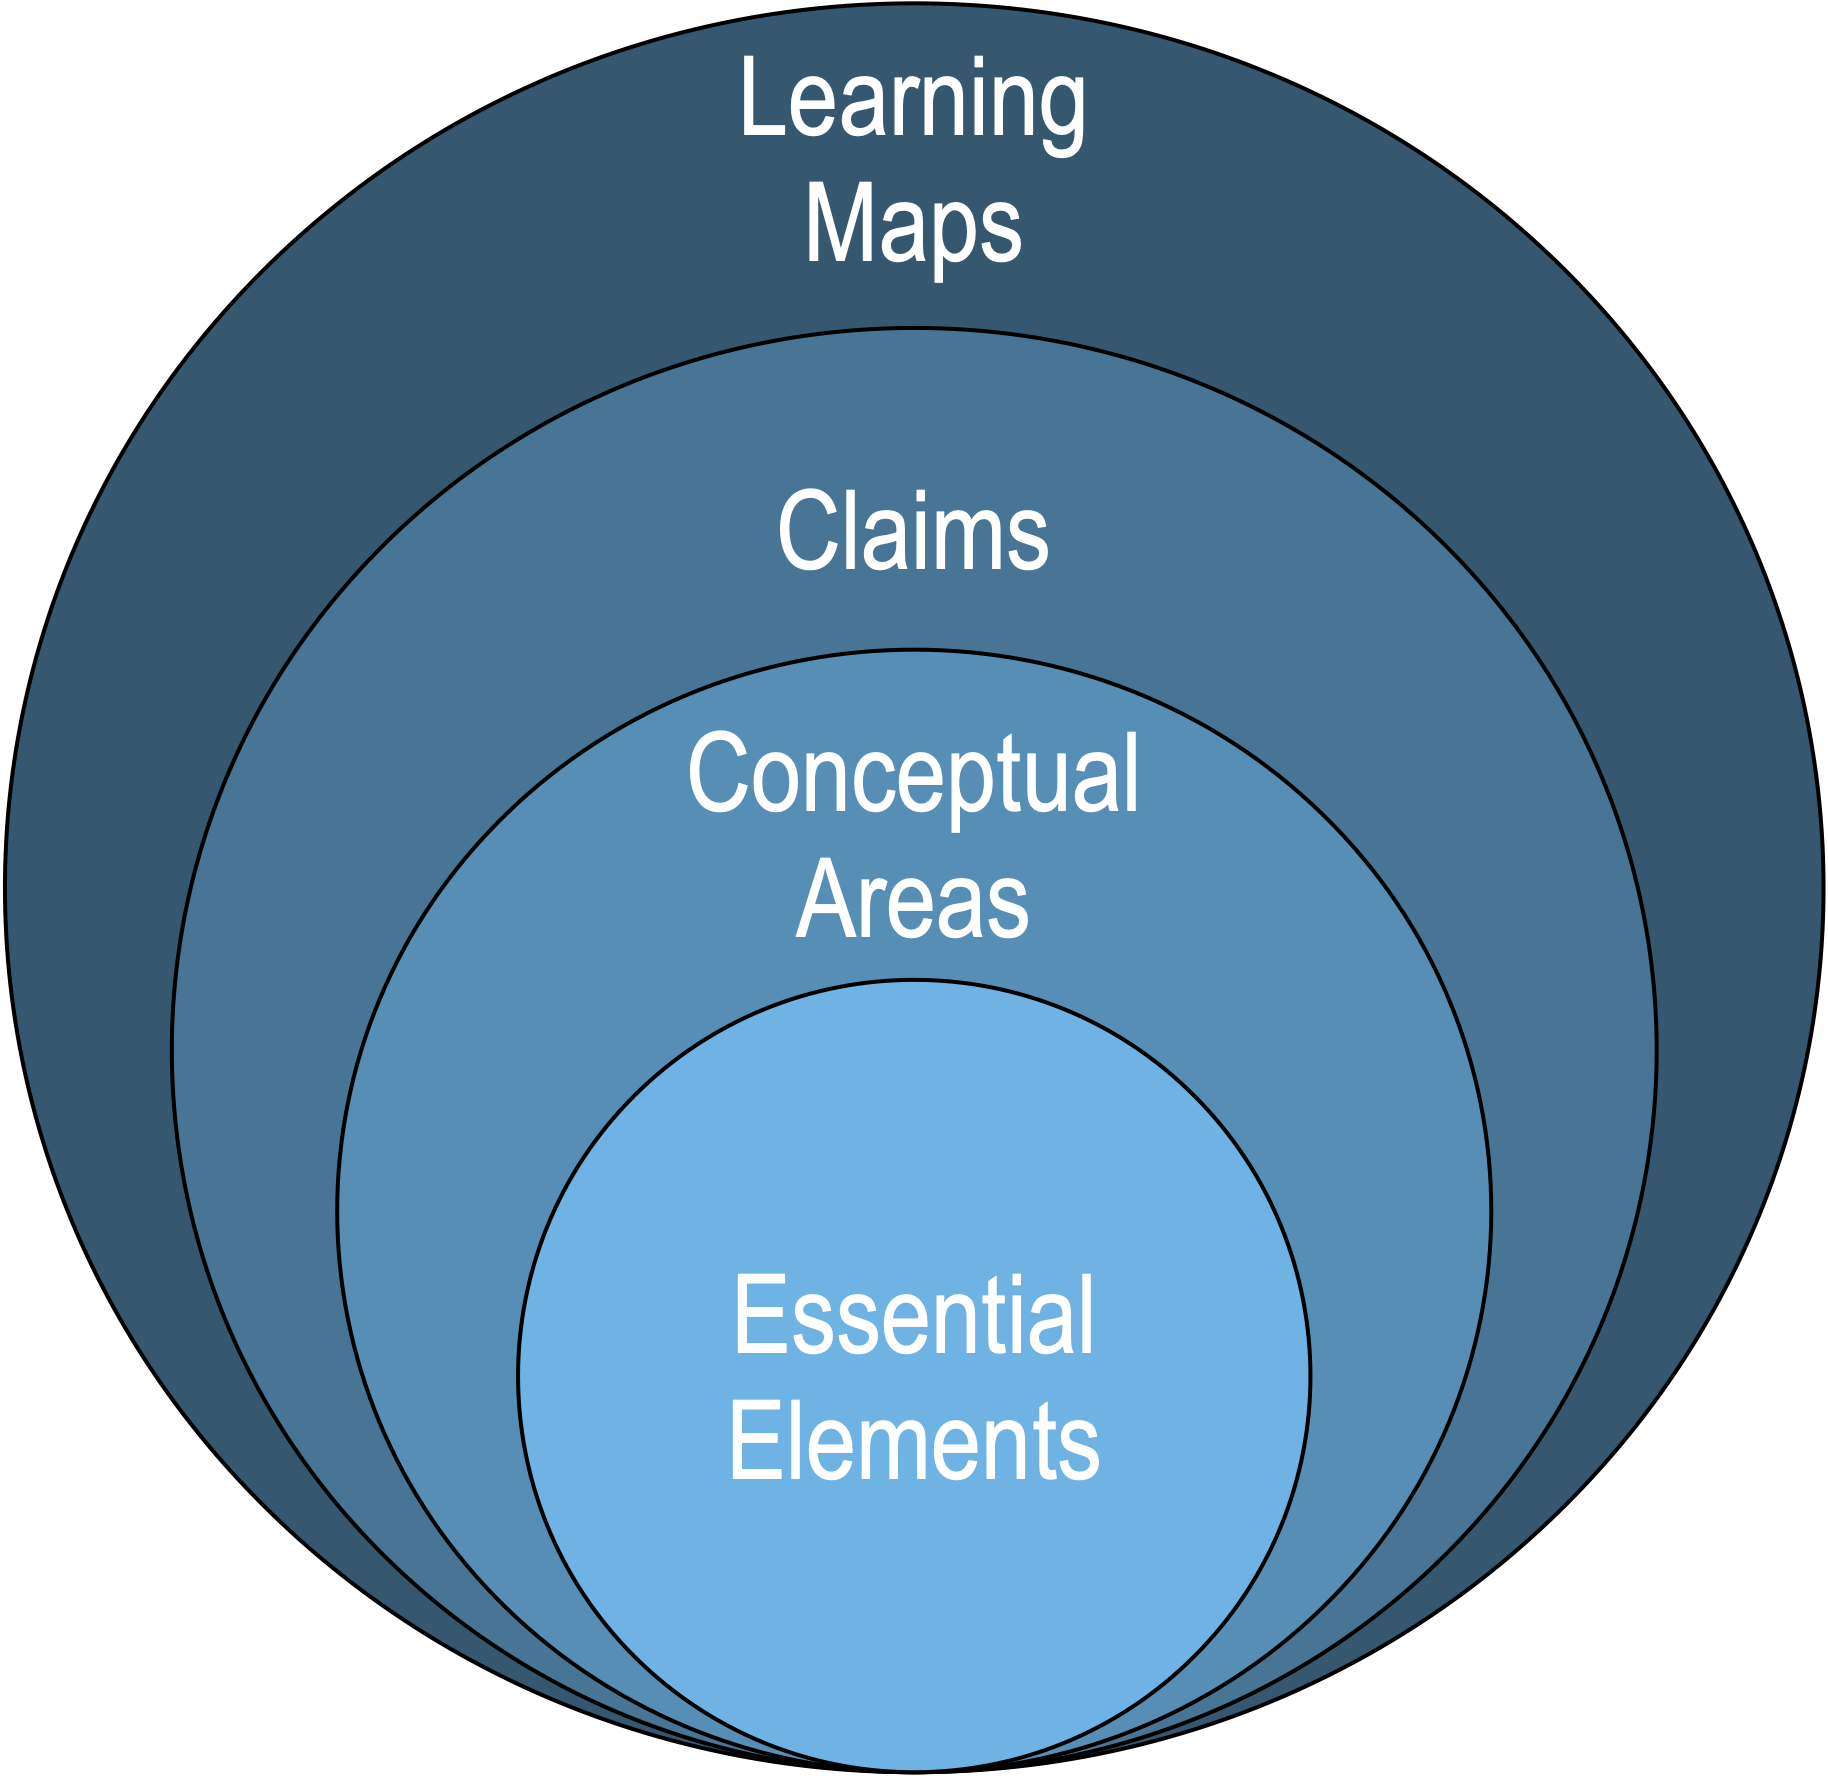
Large sections of the DLM learning maps are too complex to depict in a manageable map view or describe on a node-by-node basis. Instead, the larger sections are described by the claims and conceptual areas they represent. This organizational structure was designed to articulate where the content standards are located and their relationships to important cognitive concepts. Organization of the academic content in the DLM assessment system is illustrated conceptually in three layers (claims, conceptual areas, and EEs), as shown in Figure 2.9.
Figure 2.9: Layers of Content in the DLM Alternate Assessment System
Modern test development approaches, such as evidence-centered design (Mislevy et al., 2003; Mislevy & Riconscente, 2005), are founded on the idea that test design should start with specific claims about what students know and can do and the evidence needed to support such claims. While evidence-centered design is multifaceted, it starts with a set of claims regarding the major knowledge, skills, and understandings in the domains of interest (i.e., ELA and mathematics), as well as how it is acquired.
The DLM System divides both ELA and mathematics content into four broad claims, which are subdivided into nine conceptual areas for each subject. Claims are overt statements of what students with the most significant cognitive disabilities are expected to learn and be able to demonstrate when mastering the knowledge, skills, and understandings within a broad section of the DLM learning maps. As broad statements about expected student content learning, claims focus the scope of the assessment. Each claim includes two or three conceptual areas.
Conceptual areas are clusters of related concepts made up of multiple conceptually associated EEs and nodes that support, represent, and extend beyond the EE’s learning target(s). Conceptual areas further define the knowledge, skills, and understandings required to meet the broader claims and serve as models of how students may acquire and organize these knowledge, skills, and understandings in a subject. The DLM claims and conceptual areas apply to all grades in the system.
The four claims and nine conceptual areas for each subject are shown in Table 2.5. Following Table 2.5, Figure 2.10 provides an example of a conceptual area in the learning map.
| Claim | Conceptual area |
|---|---|
| ELA.C1: Students can comprehend text in increasingly complex ways. | ELA.C1.1: Determine Critical Elements of Text |
| ELA.C1.2: Construct Understandings of Text | |
| ELA.C1.3: Integrate Ideas and Information From Text | |
| ELA.C2: Students can produce writing for a range of purposes and audiences. | ELA.C2.1: Use Writing to Communicate |
| ELA.C2.2: Integrate Ideas and Information in Writing | |
| ELA.C3: Students can communicate for a range of purposes and audiences. | ELA.C3.1: Use Language to Communicate With Others |
| ELA.C3.2: Clarify and Contribute in Discussion | |
| ELA.C4: Students can engage in research/inquiry to investigate topics and present information. | ELA.C4.1: Use Sources and Information |
| ELA.C4.2: Collaborate and Present Ideas | |
| M.C1: Number Sense: Students demonstrate increasingly complex understandings of number sense. | M.C1.1: Understand Number Structures (Counting, Place Value, Fractions) |
| M.C1.2: Compare, Compose, and Decompose Numbers and Sets | |
| M.C1.3: Calculate Accurately and Efficiently Using Simple Arithmetic Operations | |
| M.C2: Geometry: Students demonstrate increasingly complex spatial reasoning and understanding of geometric principles. | M.C2.1: Understand and Use Geometric Properties of Two- and Three-Dimensional Shapes |
| M.C2.2: Solve Problems Involving Area, Perimeter, and Volume | |
| M.C3: Measurement Data and Analysis: Students demonstrate increasingly complex understanding of measurement, data, and analytic procedures. | M.C3.1: Understand and Use Measurement Principles and Units of Measure |
| M.C3.2: Represent and Interpret Data Displays | |
| M.C4: Algebraic and Functional Reasoning: Students solve increasingly complex mathematical problems, making productive use of algebra and functions. | M.C4.1: Use Operations and Models to Solve Problems |
| M.C4.2: Understand Patterns and Functional Thinking |
Figure 2.10: Section of the English Language Arts Learning Map for Conceptual Area ELA.C1.2
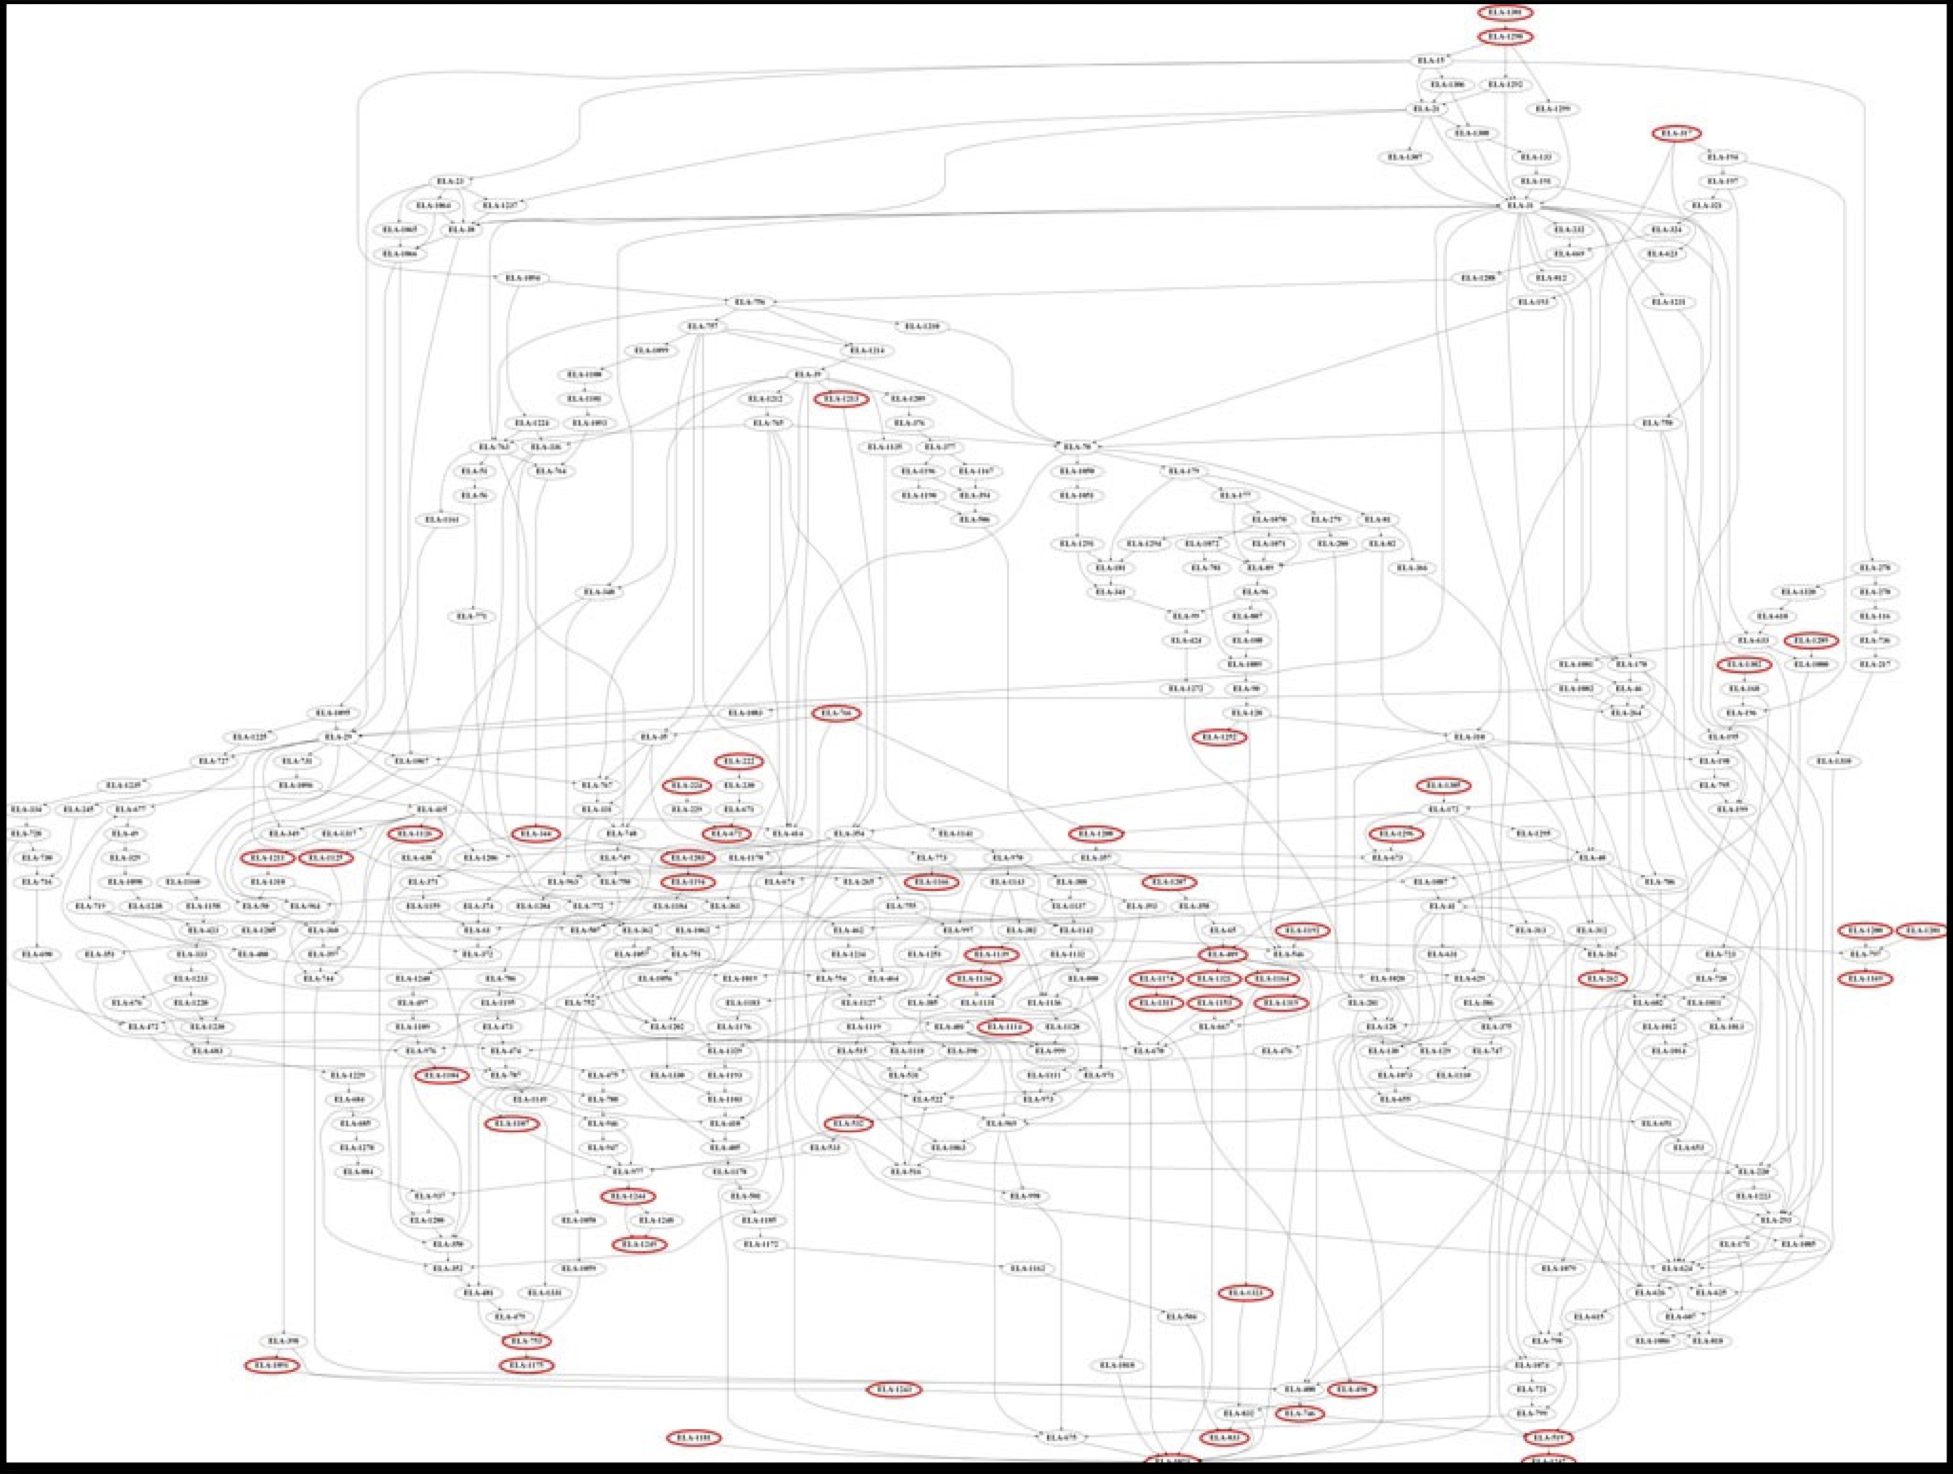
Note. Red circles indicate nodes aligned to Essential Elements.
Within each claim and conceptual area, smaller regions of the DLM learning maps are displayed in mini-maps for single EEs, as shown in Figure 2.11. Mini-maps identify which nodes are assessed at each linkage level for an EE, as well as untested nodes between the assessed nodes to support educators’ instructional decisions.
Figure 2.11: Example Mini-Map for an English Language Arts Essential Element
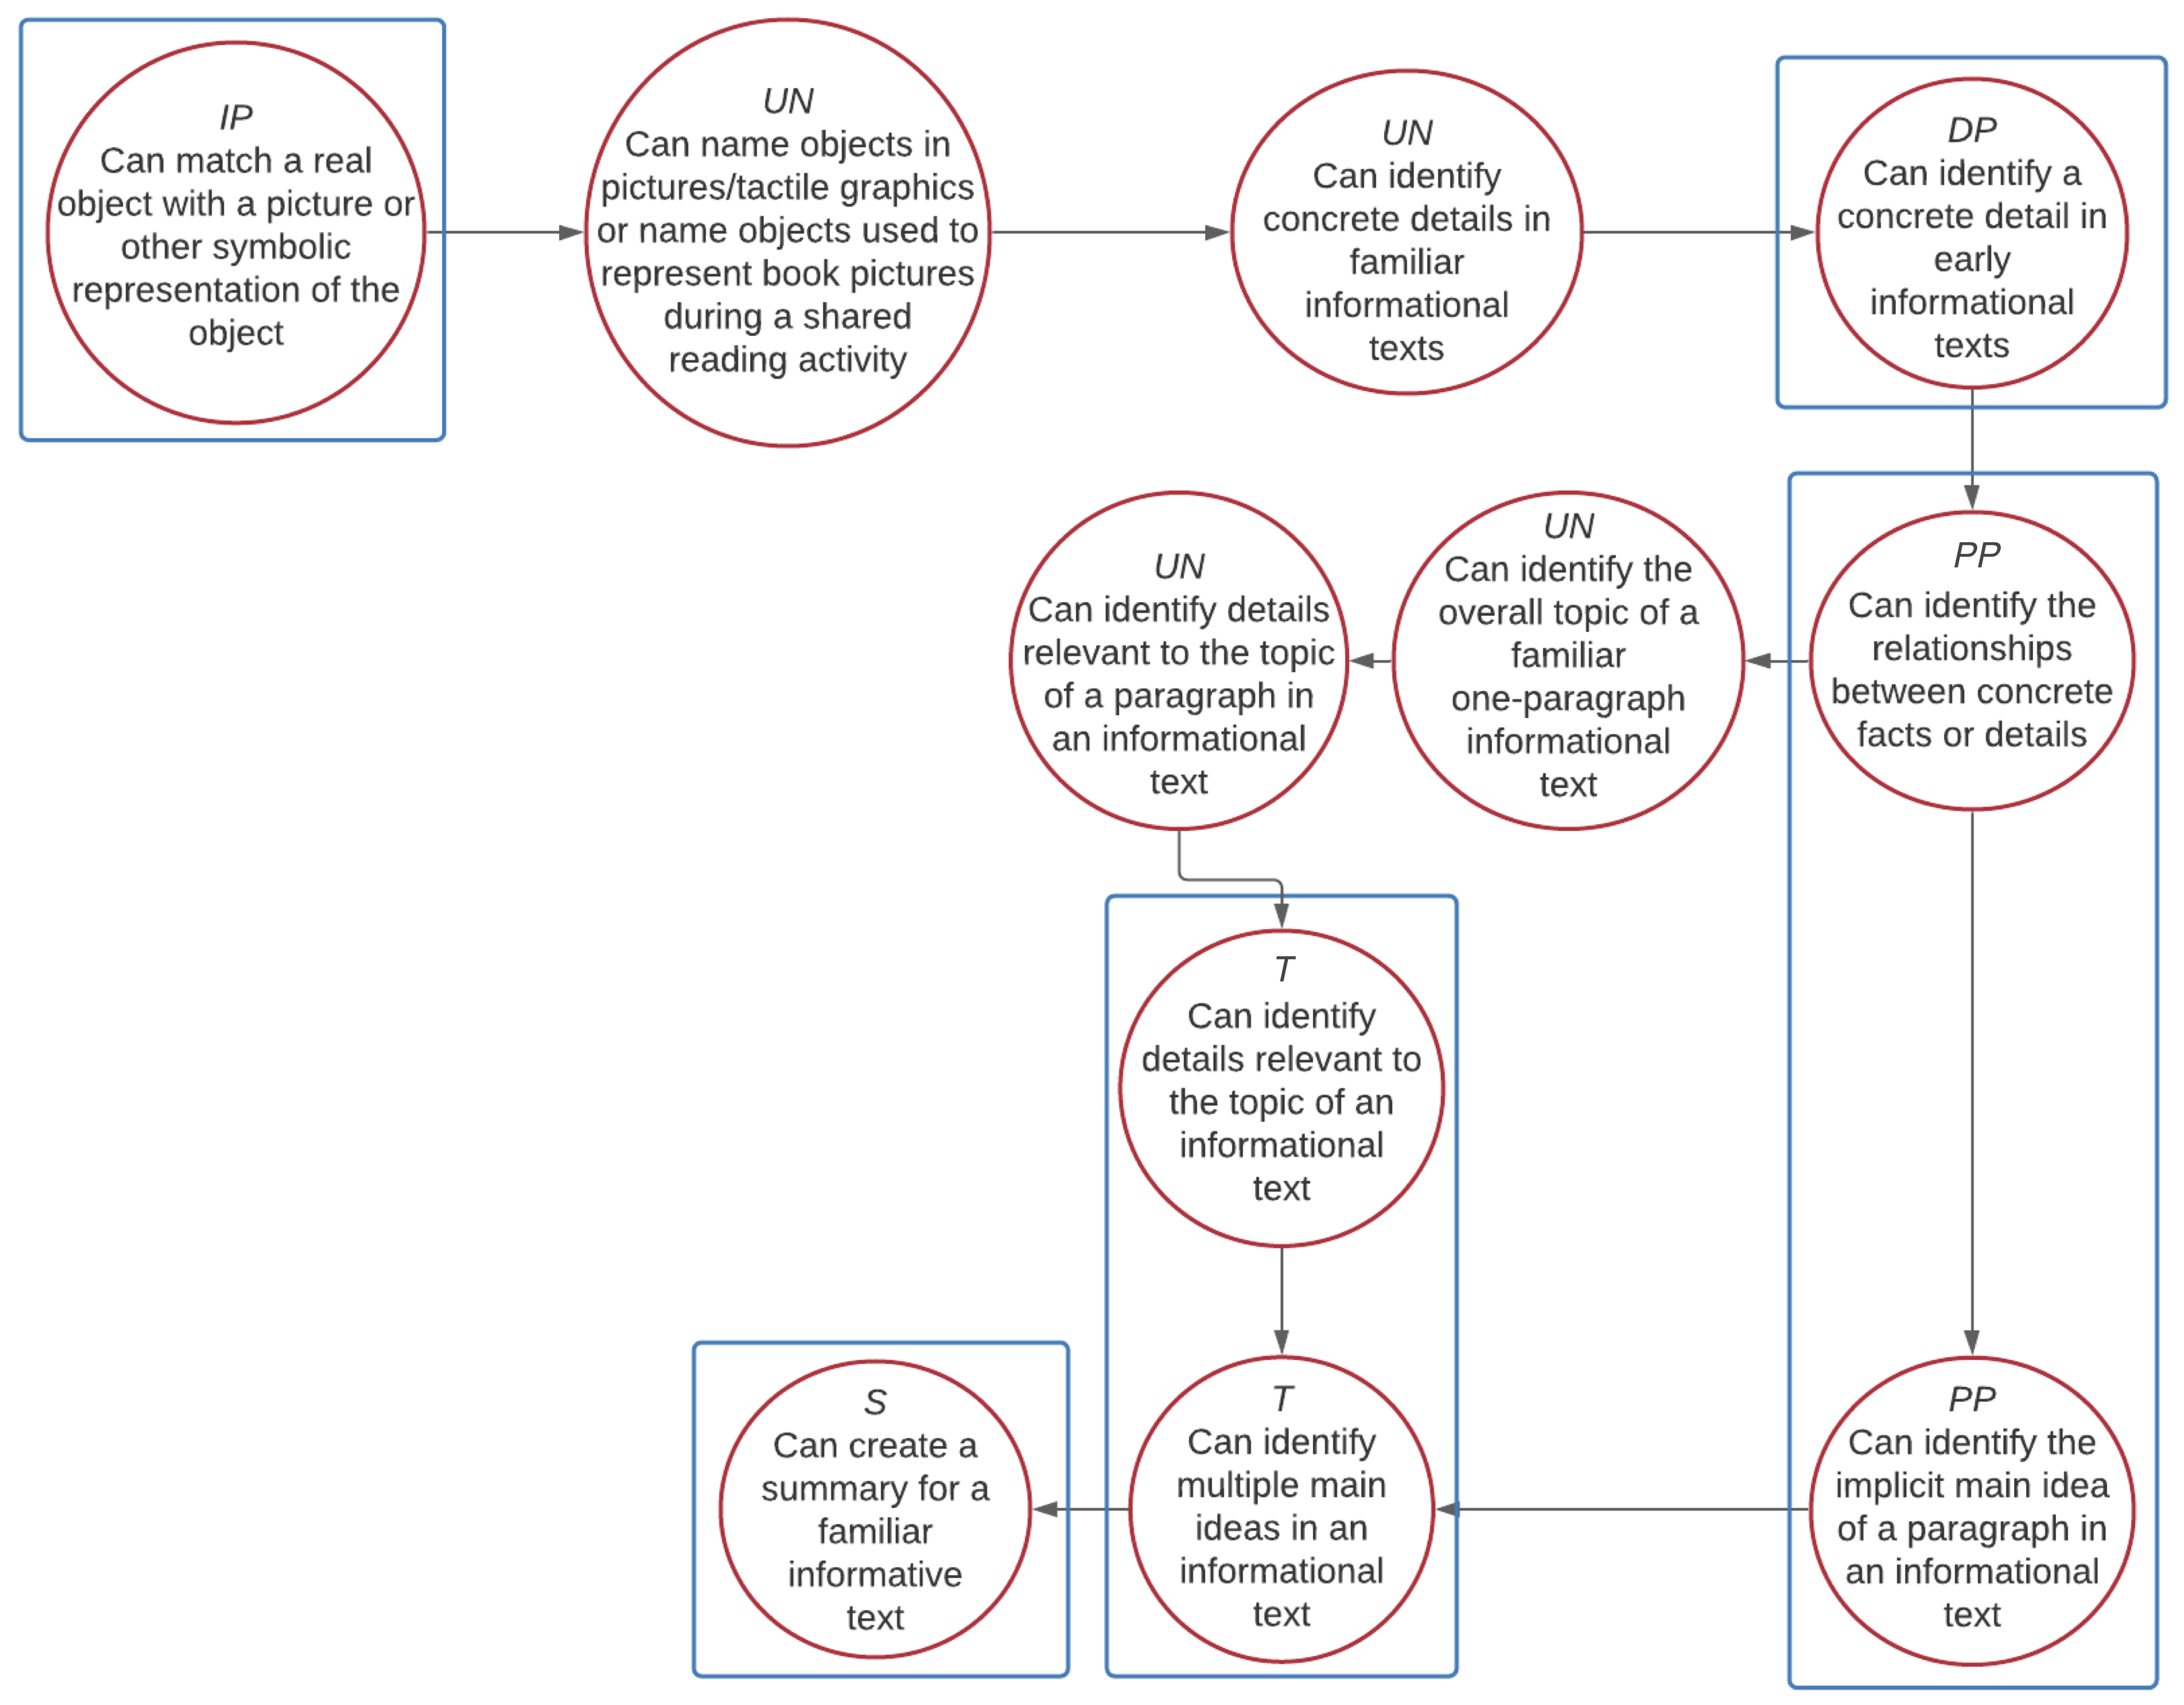
Note. Blue boxes indicate nodes organized into linkage levels. IP = Initial Precursor, DP = Distal Precursor, PP = Proximal Precursor, T = Target, S = Successor, UN = Untested node.
In summary, the DLM learning maps represent the paths students with the most significant cognitive disabilities may take to acquire the knowledge, skills, and understandings within a subject, claim, or conceptual area. EEs (the DLM learning targets) within a particular claim or conceptual area link to one another. Linkage levels are small collections of nodes which represent critical junctures on the path toward and beyond the learning target. The Target linkage level reflects the grade-level expectation aligned directly to the EE. The DLM claims and conceptual areas provide a framework for organizing nodes on the DLM learning maps and, accordingly, the EEs.
2.5 System Structure
Table 2.6 shows examples of the relationship between DLM system elements in ELA and mathematics. Assessment system elements are listed from broadest to most specific (i.e., from claim to learning map node).
| Element | Description |
|---|---|
| English language arts | |
| Claim ELA.C1 | Student can comprehend text in increasingly complex ways. |
| Conceptual area ELA.C1.1 | Determine Critical Elements of Text |
| Essential Element ELA.EE.RL.3.1 | Answer who and what questions to demonstrate understanding of details in a text. |
| Target linkage level | The student can answer who and what questions about details in a story. |
| DLM learning map node | Can answer who and what questions about details in a narrative. |
| Mathematics | |
| Claim M.C1 | Number Sense: Students demonstrate increasingly complex understanding of number sense. |
| Conceptual area M.C1.3 | Calculate Accurately and Efficiently Using Simple Arithmetic Operations |
| Essential Element M.EE.6.NS.2 | Apply the concept of fair share and equal shares to divide. |
| Target linkage level | Demonstrate understanding of division by splitting a set into an equal number of subsets and communicating the quotient as the number of equal subsets (e.g., a set consisting of 15 objects has three subsets, each containing 5 objects). |
| DLM learning map node | Demonstrate the concept of division. |
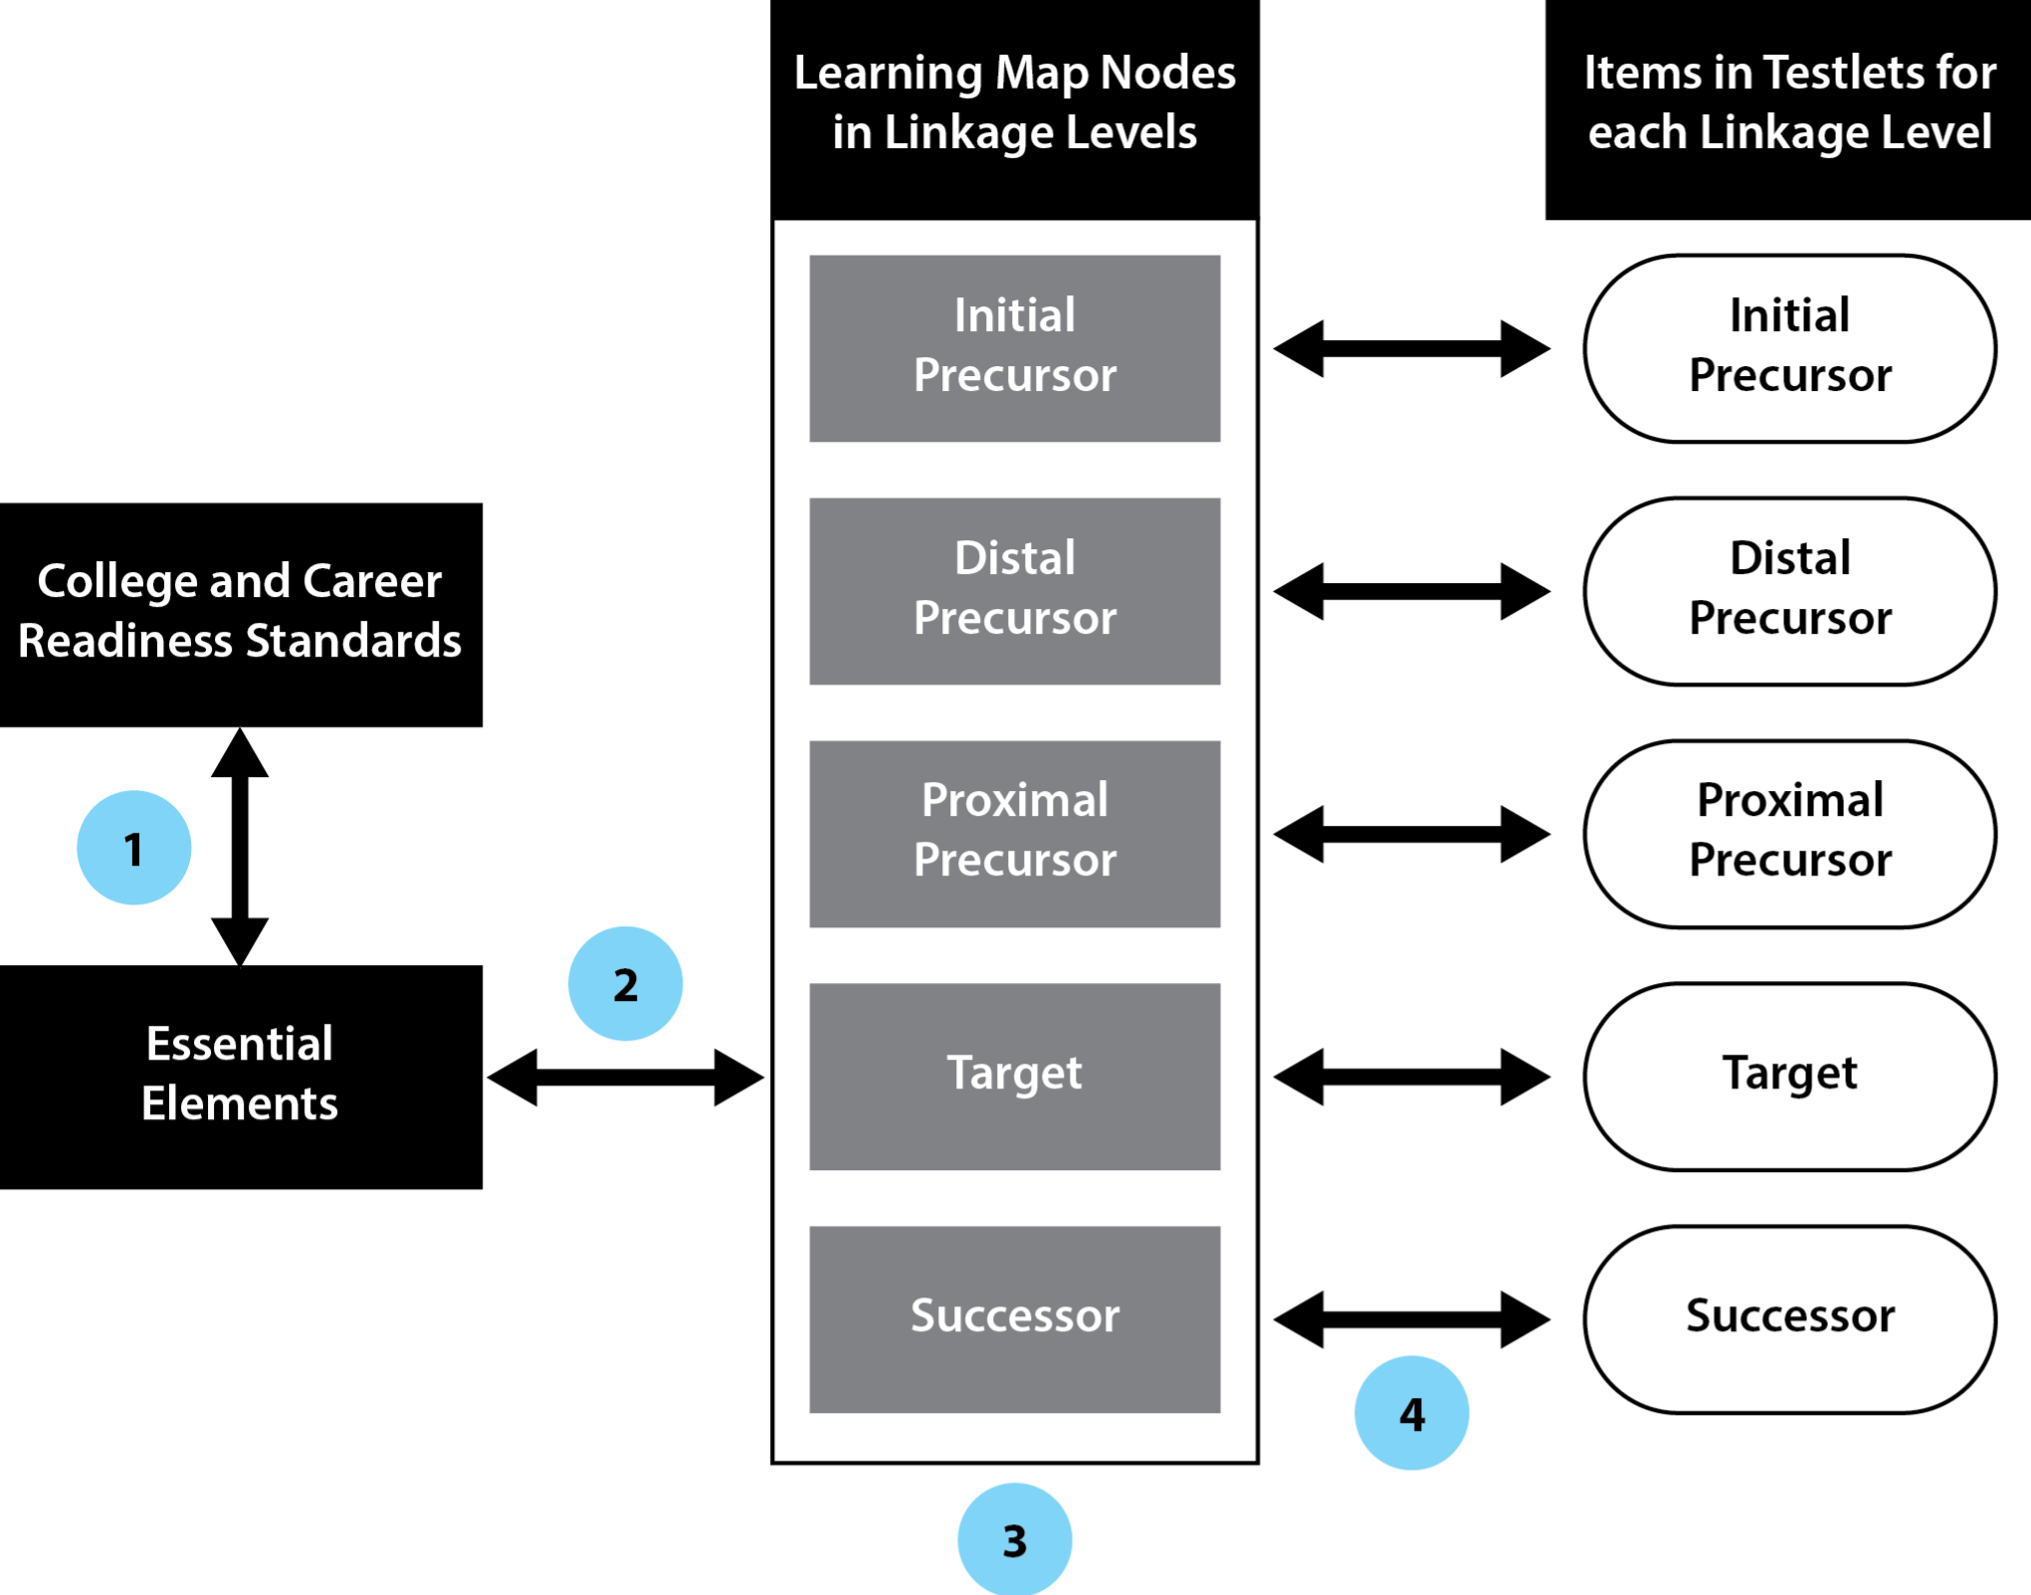
The overall structure of the DLM System has four key relationships between system elements (see Figure 2.12; the numbers below are indicated in Figure 2.12):
- College and career readiness content standards and EEs for each grade level
- An EE and its target-level node(s)
- An EE and its associated linkage levels
- DLM learning map nodes within a linkage level and assessment items
Figure 2.12: Relationships in the DLM Alternate Assessment System
2.6 Evaluation of the Learning Map Structure
Once developed, the first evaluation of the DLM learning maps consisted of educator and expert review. Subsequent empirical analyses of the structure of the DLM learning maps have also been conducted. Each of these evaluations are described in turn.
2.6.1 Educator and Expert Review
By 2014, the DLM learning maps underwent three major external reviews by educators and experts. The first two review panels (K–5 and 6–12) leveraged the content expertise of general educators in ELA and mathematics, identified by state education agency (SEA) personnel from members of the DLM Governance Board, to examine the nodes and connections in the DLM learning maps by grade level. For each node, the external content reviewers considered
- the appropriateness of cognitive complexity,
- the relationship to the CCSS, and
- the properties of the node (e.g., grain size and redundancy).
The external content reviewers then reviewed individual origin-to-destination connections for appropriateness (e.g., is the connection from skill A to skill B logical?). If the external content reviewers identified a node or connection they disagreed with, found illogical, or contained a gap, they stated the reason for their decision and attempted to provide evidence supporting it. The external content reviewers then offered potential solutions for improving the problematic node or connection, such as adding a new or current node between the two nodes in a connection. During these reviews of the DLM learning maps, the external content reviewers focused on only the typical progression of the average student in acquiring the grade-level learning targets. Following the K–5 and 6–12 external content reviews, the map developers revised the DLM learning maps to incorporate the external content reviewers’ feedback.
Additionally, as described in section 2.3.4 of this chapter, collaborators from CLDS at the University of North Carolina identified multiple sections in the DLM learning maps in which students with specific sensory, mobility, or communication disabilities might have difficulty demonstrating the node’s content. SEA personnel from the participating states identified accessibility experts across various disabilities to participate in an external accessibility review. Special educators and related service providers reviewed specific sections of the DLM learning maps to make their content and structure accessible to all students with the most significant cognitive disabilities, regardless of any sensory, mobility, or communication disabilities. The external accessibility reviewers also evaluated areas flagged by CLDS and recommended pathways to make them more accessible.
In some cases, the implementation of the principles of Universal Design for Learning (e.g., flexibility and equitability of use, Center for Applied Special Technology, 2018) could make the node’s content accessible by altering the manner of their assessment (i.e., allowing for multiple ways to demonstrate skills). When possible, the resulting nodes did not depend on information exclusively available through only one sense. In other cases, some students need to acquire unique cognitive skills to achieve a learning target (see the writing example provided in section 2.3.4). The external accessibility reviewers then identified additional pathways to support multiple means of instruction and assessment that were accessible to all students. In summary, the external accessibility reviewers proposed node and connection revisions to increase the accessibility of the DLM learning maps’ content and structure when considering assistive technology for students with specific sensory, mobility, or communication disabilities.
2.6.2 Empirical Analyses of the Learning Maps
Although items on the DLM assessments are written to measure specific nodes, For a description of item writing practices, see Chapter 3 of this manual. the linkage level is the unit of analysis for the diagnostic classification model (DCM) used to score the assessment and the unit of reporting for student score reports. See Chapter 5 and Chapter 7 of this manual for descriptions of the psychometric model used to score DLM assessments and score reporting, respectively. Because of this test design, students typically complete 3–5 items for each assessed linkage level, but may complete as few as 0 or 1 item for each node (i.e., not all nodes that comprise a linkage level are measured on every testlet). Therefore, a direct evaluation of the learning map structure is not possible with the available data, as the DCM cannot be identified at the node level (Fang et al., 2019; Xu, 2019; Xu & Zhang, 2016).
However, it is possible to evaluate the learning map structures by using the linkage levels as a proxy for the underlying maps. As described above, the linkage levels represent clusters of nodes, which are the learning targets for each EE. The five linkage levels are hypothesized to follow a linear hierarchy (i.e., more advanced linkage levels cannot be mastered if the student has not also mastered the prerequisite skills). Thus, we can begin to evaluate the learning map structure by evaluating the linear ordering of the linkage levels.
Consistent with the scoring model for DLM assessments, the linkage level ordering is evaluated using DCMs. The framework for evaluating a learning map structure using DCMs is detailed by W. J. Thompson & Nash (2022). The framework consists of three methods that each evaluate a proposed structuring of attributes (i.e., linkage levels):
Patterns of Mastery Profiles. The first method is the most direct test of an attribute structure. In this method, two DCMs are estimated: the log-linear cognitive diagnostic model (LCDM, Henson et al., 2009) and a hierarchical DCM (HDCM, Templin & Bradshaw, 2014). The LCDM allows students to have any profile of attribute (i.e., linkage level) mastery. In the HDCM, the model is constrained to only allow profiles of mastery that conform with the hierarchical structure (i.e., the five ordered DLM linkage levels). The two models can then be evaluated for model fit and compared directly using relative fit indices such as the widely applicable information criterion (WAIC, Watanabe, 2010) or Pareto-smoothed importance sampling leave-one-out cross validation (Vehtari et al., 2022; PSIS-LOO, Vehtari et al., 2017). EEs are flagged if the HDCM fits significantly worse than the LCDM, which indicates that the subset of mastery profiles included in the HDCM are insufficient for representing the range of mastery profiles demonstrated by students.
Patterns of Attribute Mastery. In this method, each attribute is estimated and scored separately as a 1-attribute LCDM (i.e., master or nonmaster of each individual linkage level). The patterns of mastery are then compared to the patterns that are expected, given the hypothesized structure (i.e., a student should not be able to master the Target level without also mastering the Proximal Precursor level). Any EE where more than 25% of students exhibit an unexpected pattern of attribute mastery is flagged for possible violations of the hierarchical linkage level ordering.
Patterns of Attribute Difficulty. In the final method, students are placed into cohorts based on their complexity band. See Chapter 4 for a description of how complexity bands are determined. We then calculate the percentage of items answered correctly (p-value) by each cohort for each linkage level. If the hierarchical structure is correct, the p-values for any one cohort should decrease as the linkage level increases (i.e., the items should get harder as the linkage level and underlying nodes become more complex). A standard error is calculated for each p-value, and 95% confidence interval is created based on the standard error. An EE is flagged if the p-value for a higher linkage level is higher (i.e., items are easier) than for the lower linkage level, and the confidence intervals do not overlap. That is, the p-value is in the opposite direction of our expectation, beyond what might be expected due to noise in the data.
As with any analysis evaluating the statistical relationship between variables, the methods outlined in the W. J. Thompson & Nash (2022) framework require data on each variable from the same participant. For the purposes of evaluating linkage level ordering, this means students must be assessed on multiple linkage levels for the same EE. Under the current assessment administration design, there are limited opportunities for collecting these cross-linkage-level data. These data can only be collected from students in Instructionally Embedded model states for whom educators choose to administer the same EE at multiple linkage levels, students in Year-End model states who participate in the optional instructionally embedded assessment window, or through targeted field testing. For example, in 2017–2018 and 2018–2019, rather than administering new content during the spring field-test window, operational forms were administered at a linkage level adjacent to the level that was tested during the operational assessment. This was done for the expressed purpose of collecting additional cross-linkage-level data to support an evaluation of the linkage level ordering. Although the targeted field test was limited to a single EE in each grade, the combined data from all sources have allowed for preliminary empirical evaluations of linkage level ordering.
Initial findings supporting the linkage level order are described in full by W. J. Thompson & Nash (2019). The patterns of mastery profiles method had limited results due to the limited availability of cross-linkage-level data. In the patterns of attribute mastery method, over 80% of EEs received no flag, indicating that the patterns of attribute mastery were consistent with the hierarchical ordering of linkage levels. Similarly, the patterns of attribute difficulty method also showed over 80% of EEs supporting the hierarchical structure of linkage levels. For a complete description of results, see W. J. Thompson & Nash (2019). Notably, most flags from the second and third methods were due to potential reversals among the higher linkage levels. This is expected, as the skills measured by the higher linkage levels are closer conceptually than the lower linkage levels. For example, in Figure 2.7, there are gaps of untested nodes between the earlier linkage levels, whereas the later tested nodes are consecutive. Therefore, it is more likely that we might observe a reversal in this situation. Although the initial findings show positive support for the linkage level ordering, additional research is planned to refine the methods and flagging criteria for identifying potential violations of the hierarchical structure. As the method are further refined, flagged EEs will undergo qualitative reviews by the test development and learning maps teams to inform potential revisions to the map structure. Updated analyses will be included in future technical manual updates as additional cross-linkage-level analyses and reviews are conducted.
2.7 Development of Assessment Blueprints
The DLM assessment blueprints specify the pool of available EEs and coverage requirements within each claim or conceptual area. The set of assessed EEs may vary across students within the boundaries of required coverage.
Blueprint development began with a proposed plan in October 2013 and was discussed extensively through September 2014, after which the governance board finalized blueprints for the 2014–2015 assessment year.. The test development teams in each subject area developed blueprint options following several guiding principles. State representatives and subject matter experts then reviewed multiple iterations of blueprints, as did the senior DLM staff and psychometricians.
2.7.1 Blueprint Development Process
The DLM Governance Board identified three overarching needs when developing the blueprints: the blueprints should have broad coverage of academic content, emphasize connections across grades, and limit administrative burden. The learning maps described above were used to prioritize EEs for inclusion in the blueprint in each subject. EEs were evaluated by determining the position within the maps of EE-aligned nodes. EEs selected for inclusion in the blueprint had the potential to maximize student progress in academic skills across grades. The general principles that guided the use of the DLM maps to develop the blueprints were to:
- prioritize interrelated content to allow for opportunities to learn ELA and mathematics skills and conceptual understandings within and across grades,
- use knowledge of academic content and instructional methods to prioritize content considered important by stakeholders,
- maximize the breadth of content coverage of EEs within each grade and subject,
- balance a need for representativeness across grades with the need to prioritize a narrower range of interconnected content to allow students the opportunity to demonstrate growth within and across grade levels, and
- select an appropriate number of EEs in a grade to prevent excessive time for administration of an assessment to students with significant cognitive disabilities.
In both subjects, some EEs were not included on the blueprint. Reasons for excluding EEs from the blueprint included:
- the EE would be very difficult to assess in a standardized, computer-based assessment,
- the EE content relied on specific sensory information (e.g., an EE that was excluded because it would likely provide a barrier to access for students with visual impairments is ELA.EE.RL.3.7, “Use information gained from visual elements and words in the text to answer explicit who and what questions.”), In this case, a different EE in the same grade, describing a similar construct, ELA.EE.RL.3.1, “Answer who and what questions to demonstrate understanding of details in a text,” was included on the blueprint, as it did not require specific attention to visual elements. and
- the EE content was more aligned to instructional goals (e.g., demonstrating understanding of text while engaged in group reading of stories) than to an assessment.
These principles were applied when making decisions about the EEs that were included in the blueprint. For instance, in ELA, the decision was made, in consultation with the governance board, to only assess Claim 1 (reading) and Claim 2 (writing). It is important to recognize that these principles were not implemented as rigid rules, but as guidelines for prioritization of the content of the EEs within and across the grades.
Test development teams for ELA and mathematics produced initial blueprint drafts by conducting a substantive review of each EE in conjunction with the location of the EE within the learning maps. The processes for ELA and mathematics differed slightly given the structural differences in the way the EEs were grouped thematically, These structural differences in groupings refer to the use of strands in ELA and clusters in mathematics. These elements were used in the CCSS and maintained in the EEs. but adhered to these basic steps:
- Review the content of the EE and its relationship to the associated grade-level content standard.
- Review the location of the node(s) associated with the Target content of the EE in the maps.
- Review the location of the node(s) associated with the Proximal, Distal, and Initial Precursors for each EE.
- Review the location of the node(s) associated with the Successor for each EE.
- Examine the relative location in the maps of all linkage levels associated with the EE to the location of related EEs in the preceding grade.
- Examine the relative location in the maps of the contents of the EE to the location of related EEs in the following grade.
- Using the map locations, prioritize EEs that were most interconnected with EEs in the same grade level.
- Using the map locations, prioritize EEs that were most interconnected with EEs at the preceding and following grade levels.
Initial drafts of test blueprints were reviewed by the DLM Governance Board and TAC members in early 2014. To ensure converage of content across claims and conceptual areas, there is a required minimum number of EEs to be assessed in certain claims in mathematics or conceptual areas in ELA at each grade level. States have the flexibility to require or recommend higher numbers of EEs be covered during the school year.
2.7.1.1 English Language Arts Blueprint
After seeking input and consent from the governance board, content in the areas of Claim 1 (reading) and Claim 2 (writing) was prioritized for inclusion in the ELA blueprint. In addition to a variety of reading testlets at each grade level, all students complete structured writing assessments in which a test administrator engages the student in a writing activity that addresses between one and six EEs in Claim 2. The EEs selected for the blueprint have:
- a broad range of potential application in novel contexts,
- the most connections to content at subsequent grade levels, and
- content that is relevant to a conceptual pathway in ELA that has applications in multiple domains or contexts.
Table 2.7 shows the number of EEs included in the ELA blueprint by grade level compared to the total number of EEs in each conceptual area. As grade level increases, more EEs are located in more cognitively complex conceptual areas.
| Grade | C1.1 | C1.2 | C1.3 | C2.1 | C2.2 | Total |
|---|---|---|---|---|---|---|
| 3 | 8/12† | 5/9 | 2/2 | 2/12 | — | 17/35 |
| 4 | 7/10 | 6/9 | 1/5 | 3/9 | 0/1 | 17/34 |
| 5 | 4/6 | 8/10 | 5/8 | 2/7 | 0/1 | 19/32 |
| 6 | 2/3 | 10/13 | 4/9 | 3/8 | 0/3 | 19/36 |
| 7 | 1/3 | 9/12 | 4/10 | 5/9 | 0/4 | 19/38 |
| 8 | 1/3 | 9/12 | 5/10 | 5/11 | 0/4 | 20/40 |
| 9–10 | 0/2 | 10/11 | 3/11 | 4/9 | 3/6 | 20/39 |
| 11–12 | 0/2 | 9/11 | 4/11 | 4/9 | 2/7 | 19/40 |
| † 8/12 indicates the blueprint contains 8 of 12 Essential Elements in grade and conceptual area. |
The full ELA blueprint is available on the DLM website, and is included in Appendix B.1.1.
2.7.1.2 Mathematics Blueprint
Like ELA, the breadth of mathematics EEs available for assessment was deliberately broad. In each grade, the approved blueprint addresses all four claims and each conceptual area relevant to the grade. All but a few EEs are included in the blueprint, excluding only those EEs that are very difficult to represent in a computer-based assessment environment. In addition to implementing these general guidelines, the mathematics blueprint reflected additional attempts to streamline the assessment across the grades to:
- avoid unnecessary redundancy in what is tested from year to year,
- highlight concepts and skills that provide students power for future mathematical learning during and beyond school, and
- acknowledge mathematical learning trajectories that connect the EEs over the course of several grades.
Table 2.8 shows the number of EEs by grade and conceptual areas included in the blueprint for each grade. Note that not all grades have EEs in all nine conceptual areas.
| Grade | C1.1 | C1.2 | C1.3 | C2.1 | C2.2 | C3.1 | C3.2 | C4.1 | C4.2 | Total |
|---|---|---|---|---|---|---|---|---|---|---|
| 3 | 3/4† | — | 1/1 | 0/1 | 1/1 | 2/3 | 1/1 | 2/2 | 1/1 | 11/14 |
| 4 | 2/2 | 2/2 | 1/1 | 3/4 | 1/2 | 3/5 | 1/2 | 2/3 | 1/1 | 16/22 |
| 5 | 2/2 | 3/4 | 2/2 | 2/2 | 1/1 | 3/3 | 1/1 | — | 1/1 | 15/16 |
| 6 | 1/1 | 2/2 | 2/2 | — | 2/2 | — | 1/2 | 3/3 | — | 11/12 |
| 7 | 2/2 | 1/1 | 3/3 | 3/4 | 1/2 | — | 2/3 | 1/2 | 1/1 | 14/18 |
| 8 | 1/1 | 1/2 | 2/2 | 4/4 | 1/1 | — | 1/1 | 1/1 | 3/5 | 14/17 |
| 9 | — | — | 3/6 | 2/4 | 1/1 | 0/1 | 0/3 | 2/4 | 0/7 | 8/26 |
| 10 | — | — | 1/6 | 1/4 | 0/1 | 1/1 | 2/3 | 2/4 | 2/7 | 9/26 |
| 11 | — | — | 2/6 | 1/4 | 0/1 | 0/1 | 1/3 | 0/4 | 5/7 | 9/26 |
| † 3/4 indicates the blueprint contains 3 of 4 Essential Elements in grade and conceptual area. |
The high school EEs are defined for the high school grade band (grades 9–11) as a whole. However, in the blueprint, mathematics high school EEs are organized and assessed in specific grade levels. The full mathematics blueprint is available on the DLM website, and is included in Appendix B.1.2.
2.8 Alignment
ACERI Partners, LLC, conducted an external alignment study of the DLM operational assessment system (Flowers & Wakeman, 2016b) to investigate the relationships between the content structures in the DLM System. A modification of Links for Academic Learning alignment methodology (Flowers et al., 2009) was used to evaluate the coherence of the DLM System. The alignment study focused on the following relationships (as illustrated by the corresponding numbers in Figure 2.12 above):
- College and career readiness content standards and EEs
- An EE and its target-level node(s)
- The vertical articulation of the linkage levels associated with an EE
- DLM learning map nodes within a linkage level and assessment items
This section describes the results of the first three relationships. For a discussion of the alignment of assessment items, see Chapter 3 of this manual.
A random sample of ELA and mathematics operational testlets from grade 3 through high school were examined. In ELA, a total of 319 testlets and 1,516 items were examined for alignment. In math, 245 testlets and 924 items were evaluated. Items and testlets were sampled from both the fall and spring pools.
Content and performance centrality were the primary measures of alignment. Content centrality is a measure of the degree of fidelity between the item/element and the content of the academic grade-level target. Specifically, it measures the degree of fidelity between the college and career readiness standard and the EE or between the EE and the target-level node(s). Panelists rated each pair as having no link, a far link, or a near link. Performance centrality represents the degree to which the operational assessment item and the corresponding academic grade-level content target contain the same performance expectation. Specifically, performance centrality measures the degree to which the performance expectation matches between the college and career readiness standard and the EE or between the EE and the target-level node(s). Panelists rated the degree of performance centrality between each pair as none, some, or all. If panelists identified a relationship that did not meet criteria for alignment (e.g., no link for content centrality), they provided additional feedback. When evaluating items, panelists used the DLM cognitive process dimension taxonomy to identify the category for the highest cognitive dimension required of the student when responding to the item.
The following sections provide a brief summary of findings from the external alignment study. Full results are provided in the separate technical report (Flowers & Wakeman, 2016a).
2.8.1 Alignment of College and Career Readiness Standards and Essential Elements
All EEs identified in the assessment blueprints were included in these analyses. Table 2.9 and Table 2.10 display the results of content centrality and performance centrality ratings, respectively. For content centrality, EEs were defined as “Met” if they were given a “Far” or “Near” rating. For performance centrality, EEs were defined as “Met” if they were given a “Some” or “All” rating. The level of acceptable content centrality for alternate assessments is 80% (Flowers et al., 2009). No recommended acceptable level of performance centrality is provided for alternate assessments. In ELA 83% of EEs were rated as maintaining fidelity to the content and the grade-level college and career readiness standards, and 100% of EEs of were rated as having the same performance expectation. Similarly, in mathematics 81% of EEs were rated as maintaining fidelity, and 83% were rated and having the same performance expectation. This is an acceptable level of alignment given the rigor of grade-level standards and the need to provide access for all students with the most significant cognitive disabilities. EEs that were rated “No” for maintaining fidelity or “None” for having the same performance expectation were forwarded to the test development teams for further review.
| Subject | Total N | No (%) | Far (%) | Near (%) | Met (%) | Lower CI | Upper CI |
|---|---|---|---|---|---|---|---|
| English language arts | 149 | 25 (17) | 99 (66) | 25 (17) | 124 (83) | 77 | 88 |
| Mathematics | 145 | 28 (19) | 106 (73) | 11 (8) | 117 (81) | 74 | 86 |
| Note. CI = 90% confidence interval. Grey shading indicates acceptable level of alignment. |
| Subject | Total N | None (%) | Some (%) | All (%) | Met (%) | Lower CI | Upper CI |
|---|---|---|---|---|---|---|---|
| English language arts | 124 | 0 (0) | 102 (82) | 22 (18) | 124 (100) | 98 | 100 |
| Mathematics | 117 | 20 (17) | 77 (66) | 20 (17) | 97 (83) | 76 | 88 |
| Note. CI = 90% confidence interval. Grey shading indicates acceptable level of alignment. |
2.8.2 Alignment of Essential Element and Target-Level Nodes
Table 2.11 and Table 2.12 display the content and performance centrality of the alignment of EEs to target-level node(s), which are the node(s) that reflect the grade-level expectation in the EE. The number of EEs in Table 2.11 and Table 2.12 is different from Table 2.9 and Table 2.10 because some EEs corresponded to more than one target-level node. All EEs were rated as aligned to the target-level nodes with most EEs rated as near the target-level node. Similar results were found for performance centrality. All EEs were rated as meeting some or all of the performance expectations found in the target-level node. These findings suggest a strong alignment between EEs and target-level nodes.
| Subject | Total N | No (%) | Far (%) | Near (%) | Met (%) | Lower CI | Upper CI |
|---|---|---|---|---|---|---|---|
| English language arts | 148 | 0 (0) | 11 (7) | 137 (93) | 148 (100) | 98 | 100 |
| Mathematics | 219 | 0 (0) | 54 (25) | 165 (75) | 219 (100) | 99 | 100 |
| Note. CI = 90% confidence interval. Grey shading indicates acceptable level of alignment. |
| Subject | Total N | None (%) | Some (%) | All (%) | Met (%) | Lower CI | Upper CI |
|---|---|---|---|---|---|---|---|
| English language arts | 148 | 0 (0) | 20 (14) | 128 (86) | 148 (100) | 98 | 100 |
| Mathematics | 219 | 0 (0) | 50 (23) | 169 (77) | 219 (100) | 99 | 100 |
| Note. CI = 90% confidence interval. Grey shading indicates acceptable level of alignment. |
2.8.3 Vertical Articulation of Linkage Levels for Each Essential Element
Panelists evaluated linkage levels to see if they reflected a progression of knowledge, skills, and understandings. Table 2.13 shows the results of the vertical articulation of the linkage levels for the EEs at each grade level for ELA and mathematics. For ELA, 147 linkage levels were reviewed by panelists and 120 (82%) were rated as showing a clear progression from precursor to successor nodes. The low rating for seventh grade was due to panelists reporting that the Initial Precursor was not clearly part of the progression in the ordered nodes. For math, 103 linkage levels were reviewed and 99 linkage levels (96%) were rated as demonstrating a clear progression in the ordered nodes. EEs that were rated as not reflecting a clear progression were forwarded to the test development teams for further review.
| Grade | Total N | Clear Progression (%) |
|---|---|---|
| English language arts | ||
| 3 | 17 | 15 (88) |
| 4 | 17 | 14 (92) |
| 5 | 19 | 15 (79) |
| 6 | 19 | 15 (79) |
| 7 | 18 | 10 (56) |
| 8 | 20 | 17 (85) |
| 9–10 | 19 | 17 (89) |
| 11–12 | 18 | 17 (94) |
| Total | 147 | 120 (82) |
| Mathematics | ||
| 3 | 11 | 10 (91) |
| 4 | 16 | 15 (94) |
| 5 | 15 | 14 (93) |
| 6 | 11 | 10 (91) |
| 7 | 10 | 10 (100) |
| 8 | 14 | 14 (100) |
| 9 | 8 | 8 (100) |
| 10 | 9 | 9 (100) |
| 11 | 9 | 9 (100) |
| Total | 103 | 99 (96) |
2.9 Learning Maps for the Operational Assessment
Table 2.14 includes the overall statistics describing the DLM learning maps as implemented for the operational assessment. This version of the set of ELA, mathematics, and foundational DLM learning maps is the basis for the operational assessments. Foundational nodes support both ELA and mathematics maps.
| Node category | Number of nodes | Number of connections |
|---|---|---|
| Foundational | 150 | 277 |
| English language arts | 1,919 | 5,045 |
| Mathematics | 2,399 | 5,200 |
| Total | 4,468 | 10,522 |
2.10 Conclusion
The DLM assessments are built on learning maps that describe pathways for students to acquire knowledge, skills, and understandings. Different areas of the map are associated with conceptual areas and EEs, which are the learning targets for the DLM assessments. To ensure all students have access to grade-level academic content, each EE is available at five linkage levels, which are small collections of nodes that represent critical junctures on the path toward and beyond the learning target. Both the learning maps and EEs were developed by subject-matter experts synthesizing the research literature with stakeholder feedback. Procedural evidence and preliminary empirical evidence both support the structure of the DLM learning maps. Finally, the external alignment study provides evidence of the connections between DLM System components and the college and career readiness standards, via EEs, learning map nodes, and linkage levels.